December Bay Area Housing Market Update – 2021 Market Crash Rumor?

Welcome to the Bay Area housing market! I am so excited and also sad because this is our last Bay Area housing market update for 2020. Again, I have spent a lot of time gathering all the research and all the statistics, but most importantly, I really wanted to show you guys some of our real-life case studies on what is going with these offers that we’re making. I hope you enjoy this month’s blog post! A video version is also available here.
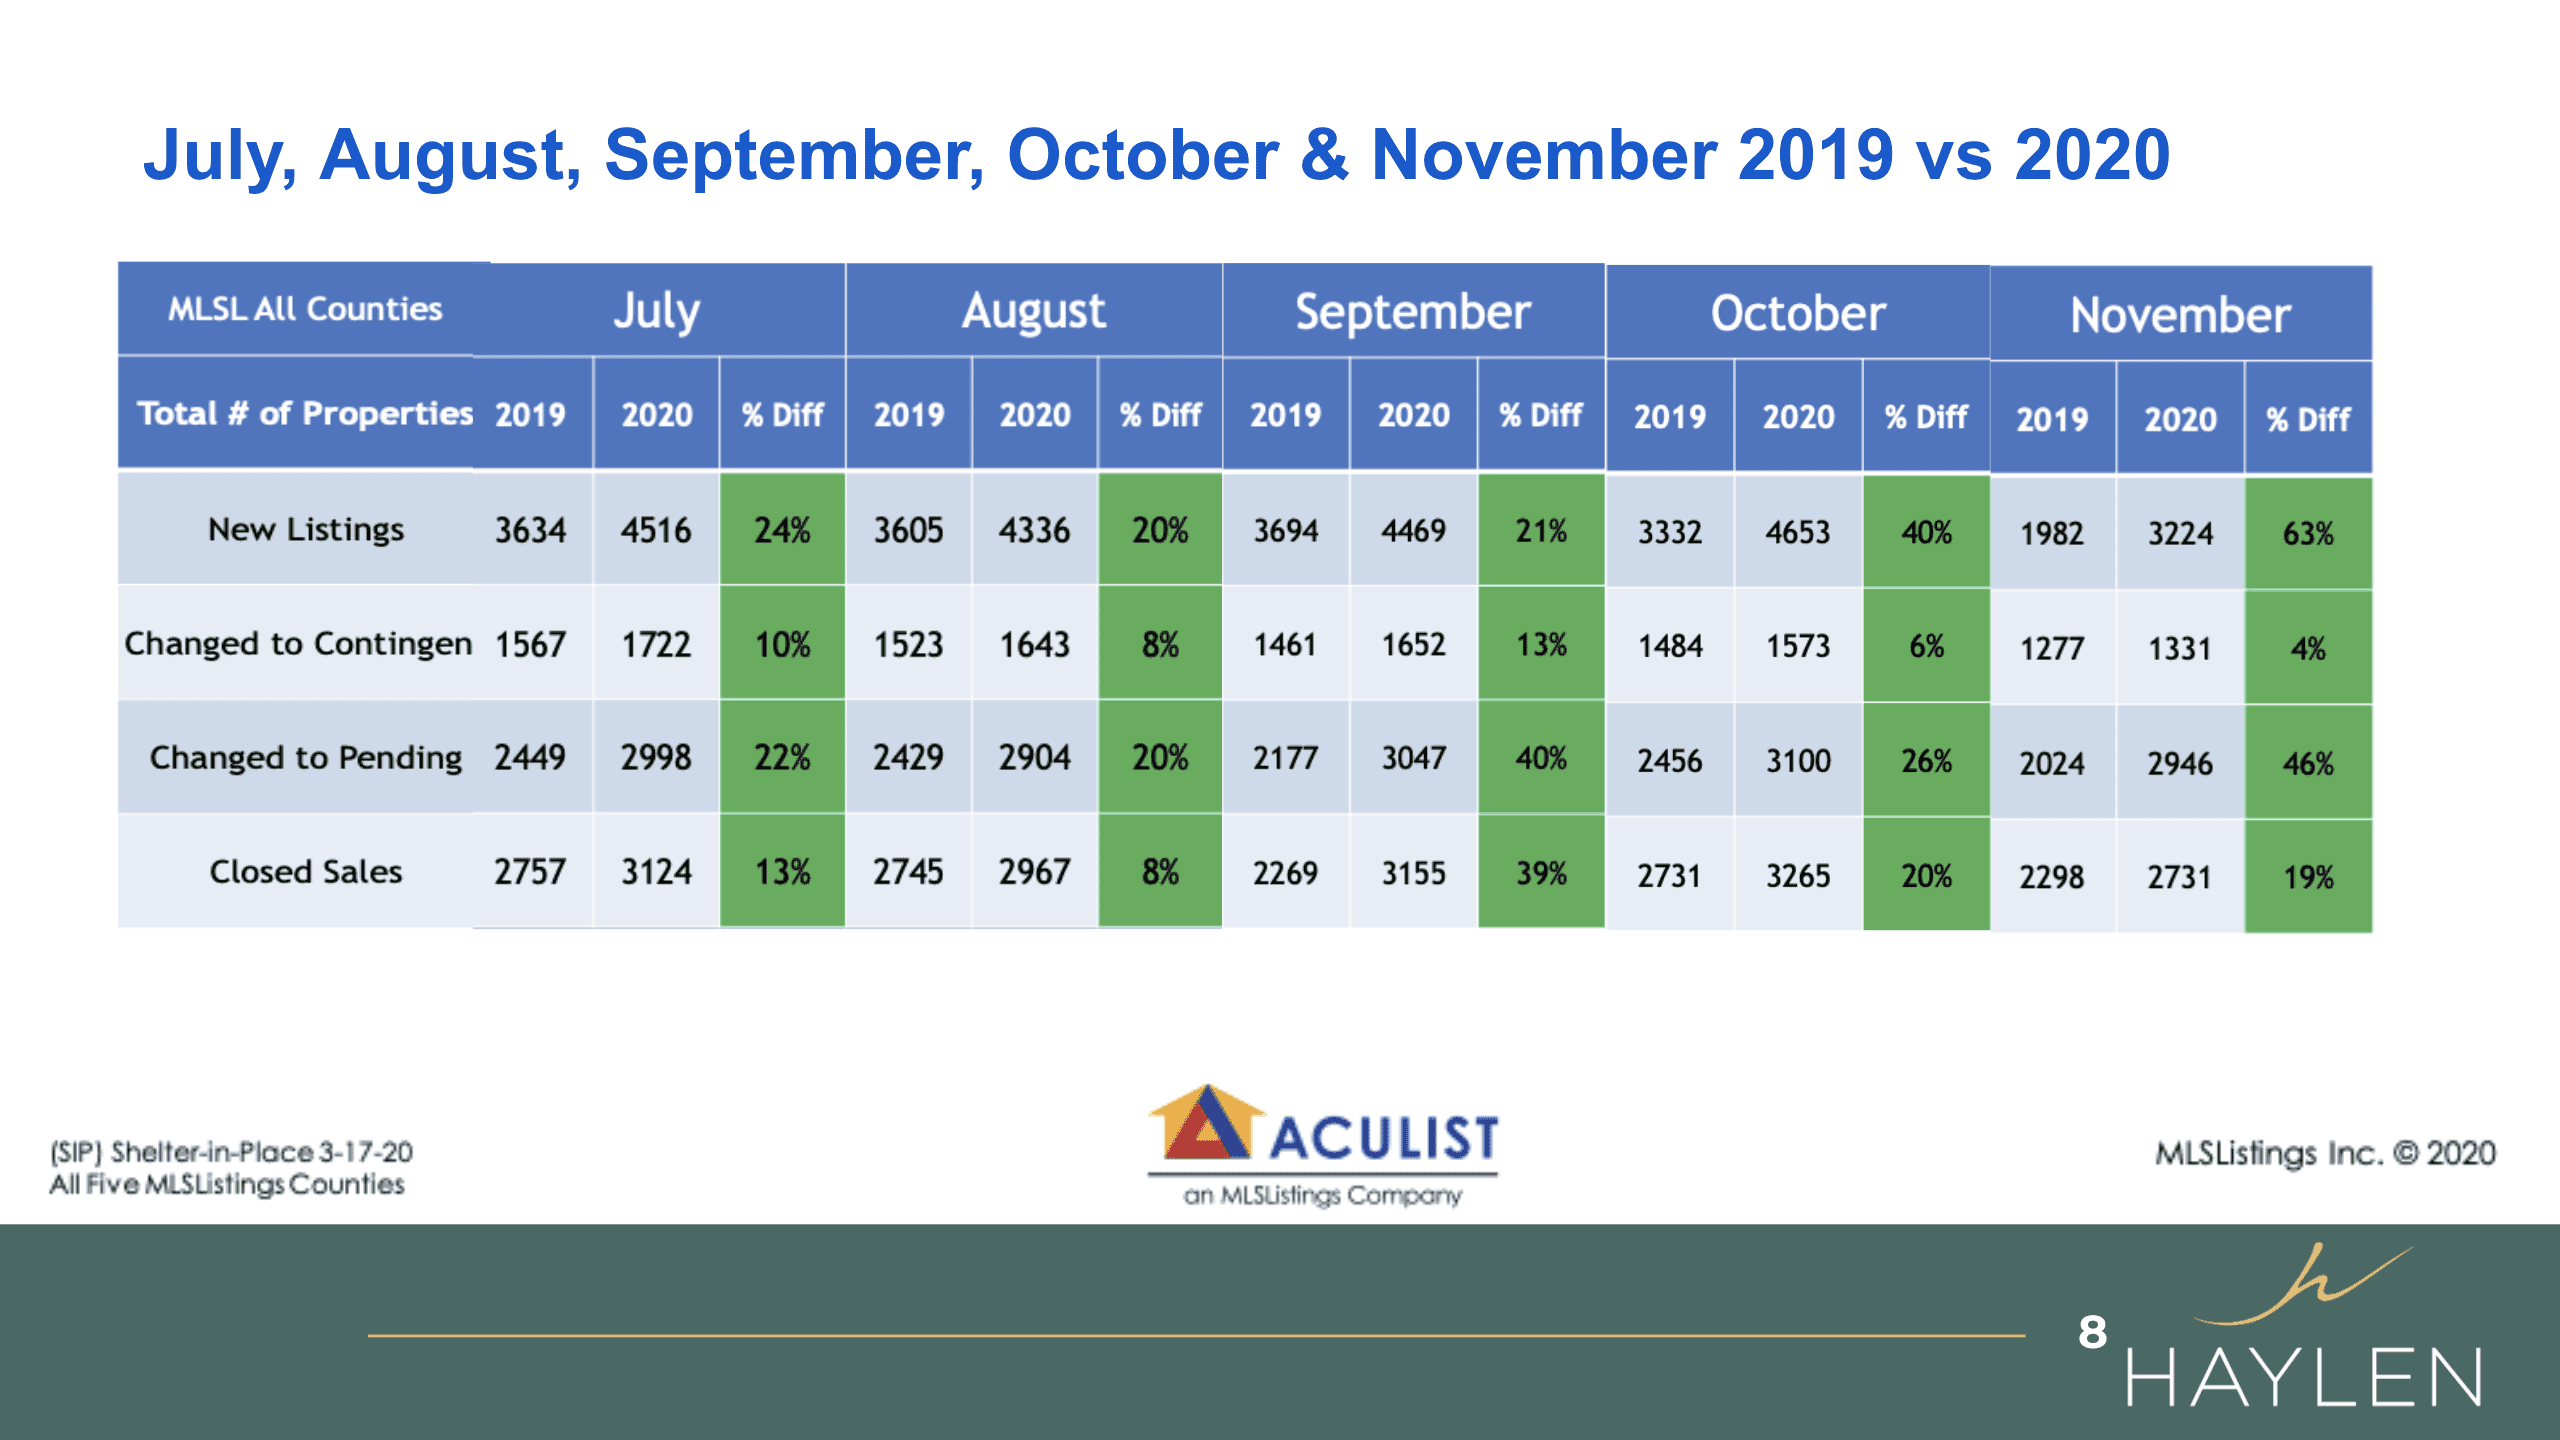
Let’s start with the five MLS counties that we collected the data from July all the way to November. As you can see that now, regarding new listings we still have a lot more compared to last year. Especially November we have 63%, typically by end of the year, especially in November, our listings come down because of the holidays. But this year, again, we have a very unusual year, so in November we still have a lot of listings that are coming out. The same thing for the properties that went under contract, and you can see that most of the properties have changed to pending. The difference between pending and contingency is that pending has no contingency in the offer, so basically buyers are committed to buying the property. As you see that it has changed quite drastically again from the 2019 number, and then closed sales we have almost 20% more than last year. 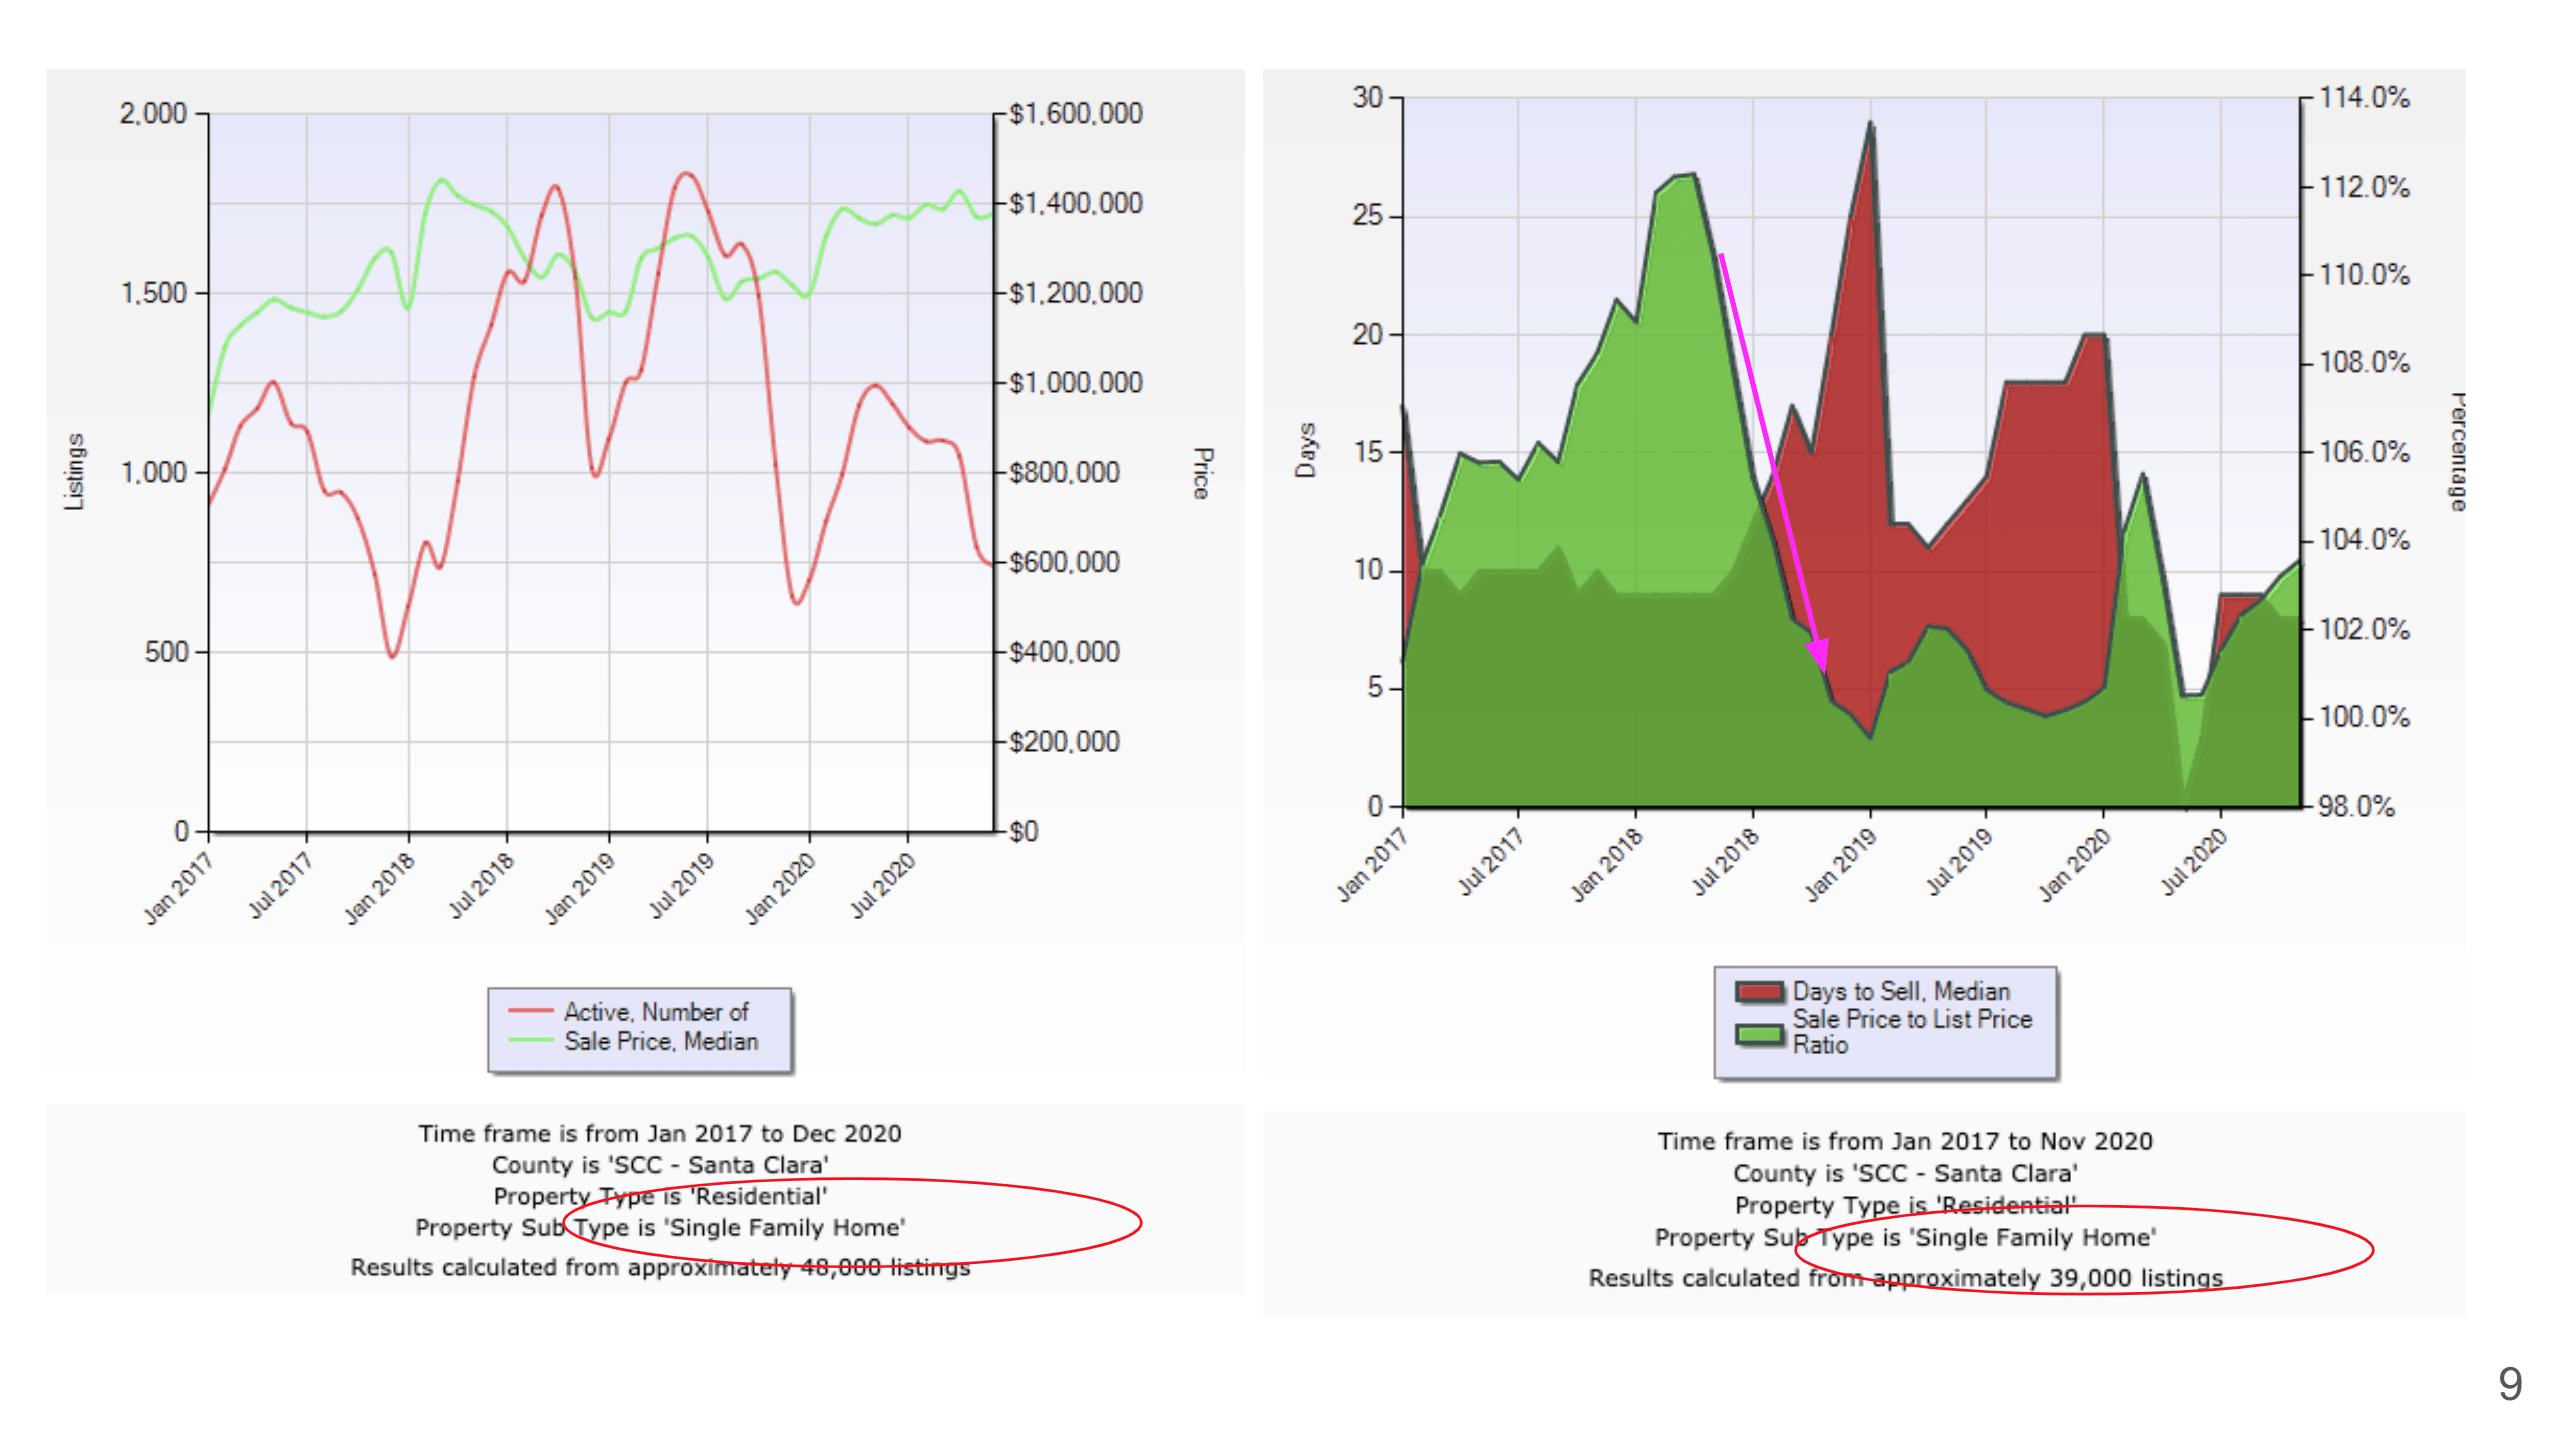
Here are some of the charts that I want to share with you. This is data on single family homes from 2017 to 2020 based on Santa Clara County only. If you look at 2018, I thought it is interesting because the number of active sales dropped at the end of 2017, again, it is very normal that it drops at the end of the year, and it came back up in 2018. So if you guys remember 2018 we had a lot of sales, and the price had gone up quite significantly also at the beginning of the year. Then towards the end of 2018, this is when again our inventory dropped, and then it came back up, but the price actually had gone down. If you remember, 2019 was actually really slow. The funniest thing is that I remember sitting in my open houses talking to a lot of buyers, and so many buyers told me the same thing that they wanted to wait until 2020 when the market crashes. Now, let’s look at what happened in 2020. Again, at the end of 2019, the inventory went down, then it started picking up, but the price, instead of crashing, just shot right up. Right before COVID happened, we were seeing that the price had gone up, and then even during and after COVID, the price did not drop significantly, rather it actually continued to stay pretty strong, and still high compared to 2019.
If you look at the chart on the right side, the same thing. It shows the sales price over the list price, so we see how competitive the market is, and also the number of days on the market. In 2018 we were bidding 12% over the asking price, and the properties were on the market for less than 10 days in Santa Clara County. In 2019, it just dropped drastically to, you know, people offering around asking price, they are not really bidding as strongly anymore. Until January, it was shot back up again, and of course, due to COVID we had a drop where there was no showing, but we were still slightly above 100%, believe it or not, during that time. Then as soon as the showing market opened up, it continued to go up about 4%.
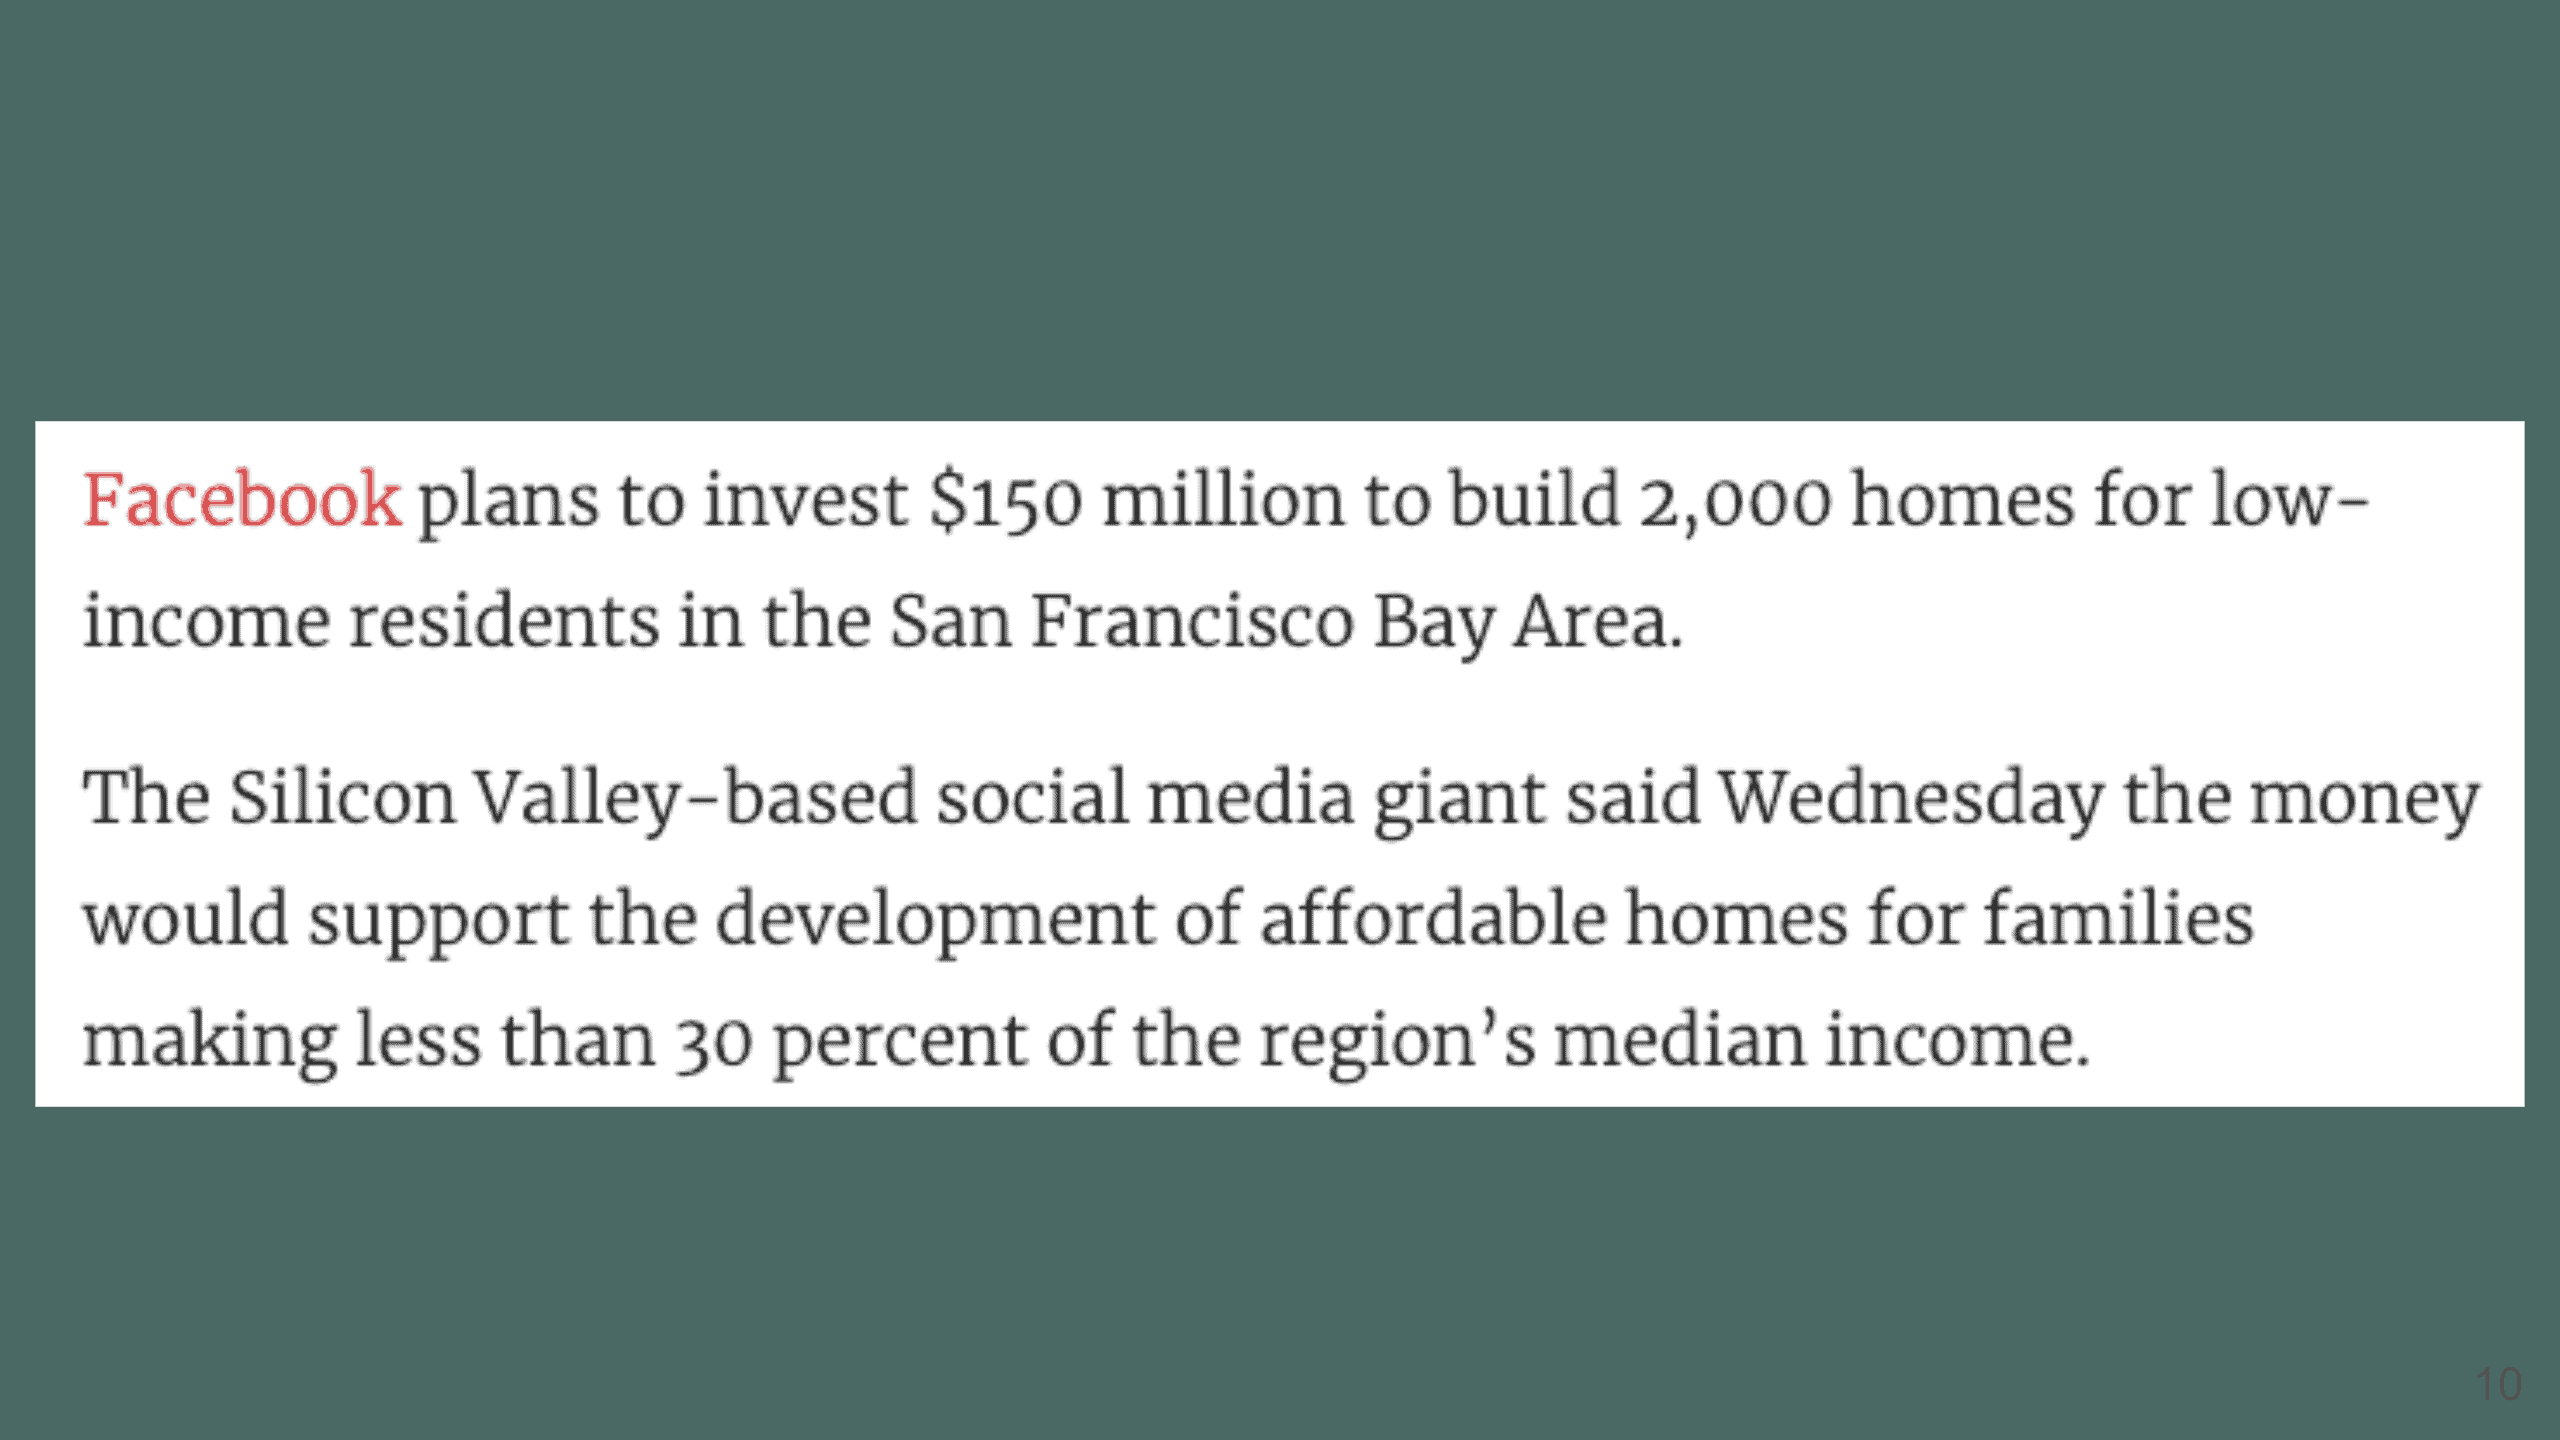
I also want to share with you that today there’s news talking about Facebook’s plans to invest another 150 million dollars to build 2000 homes for low-income residents in the San Francisco Bay Area market. As you know that the price has gone up because we just don’t have enough inventory, so Facebook is going to dedicate this amount of money to build 2000 homes for low-income residents, which include, I believe one-third, is going to be in Santa Clara County.
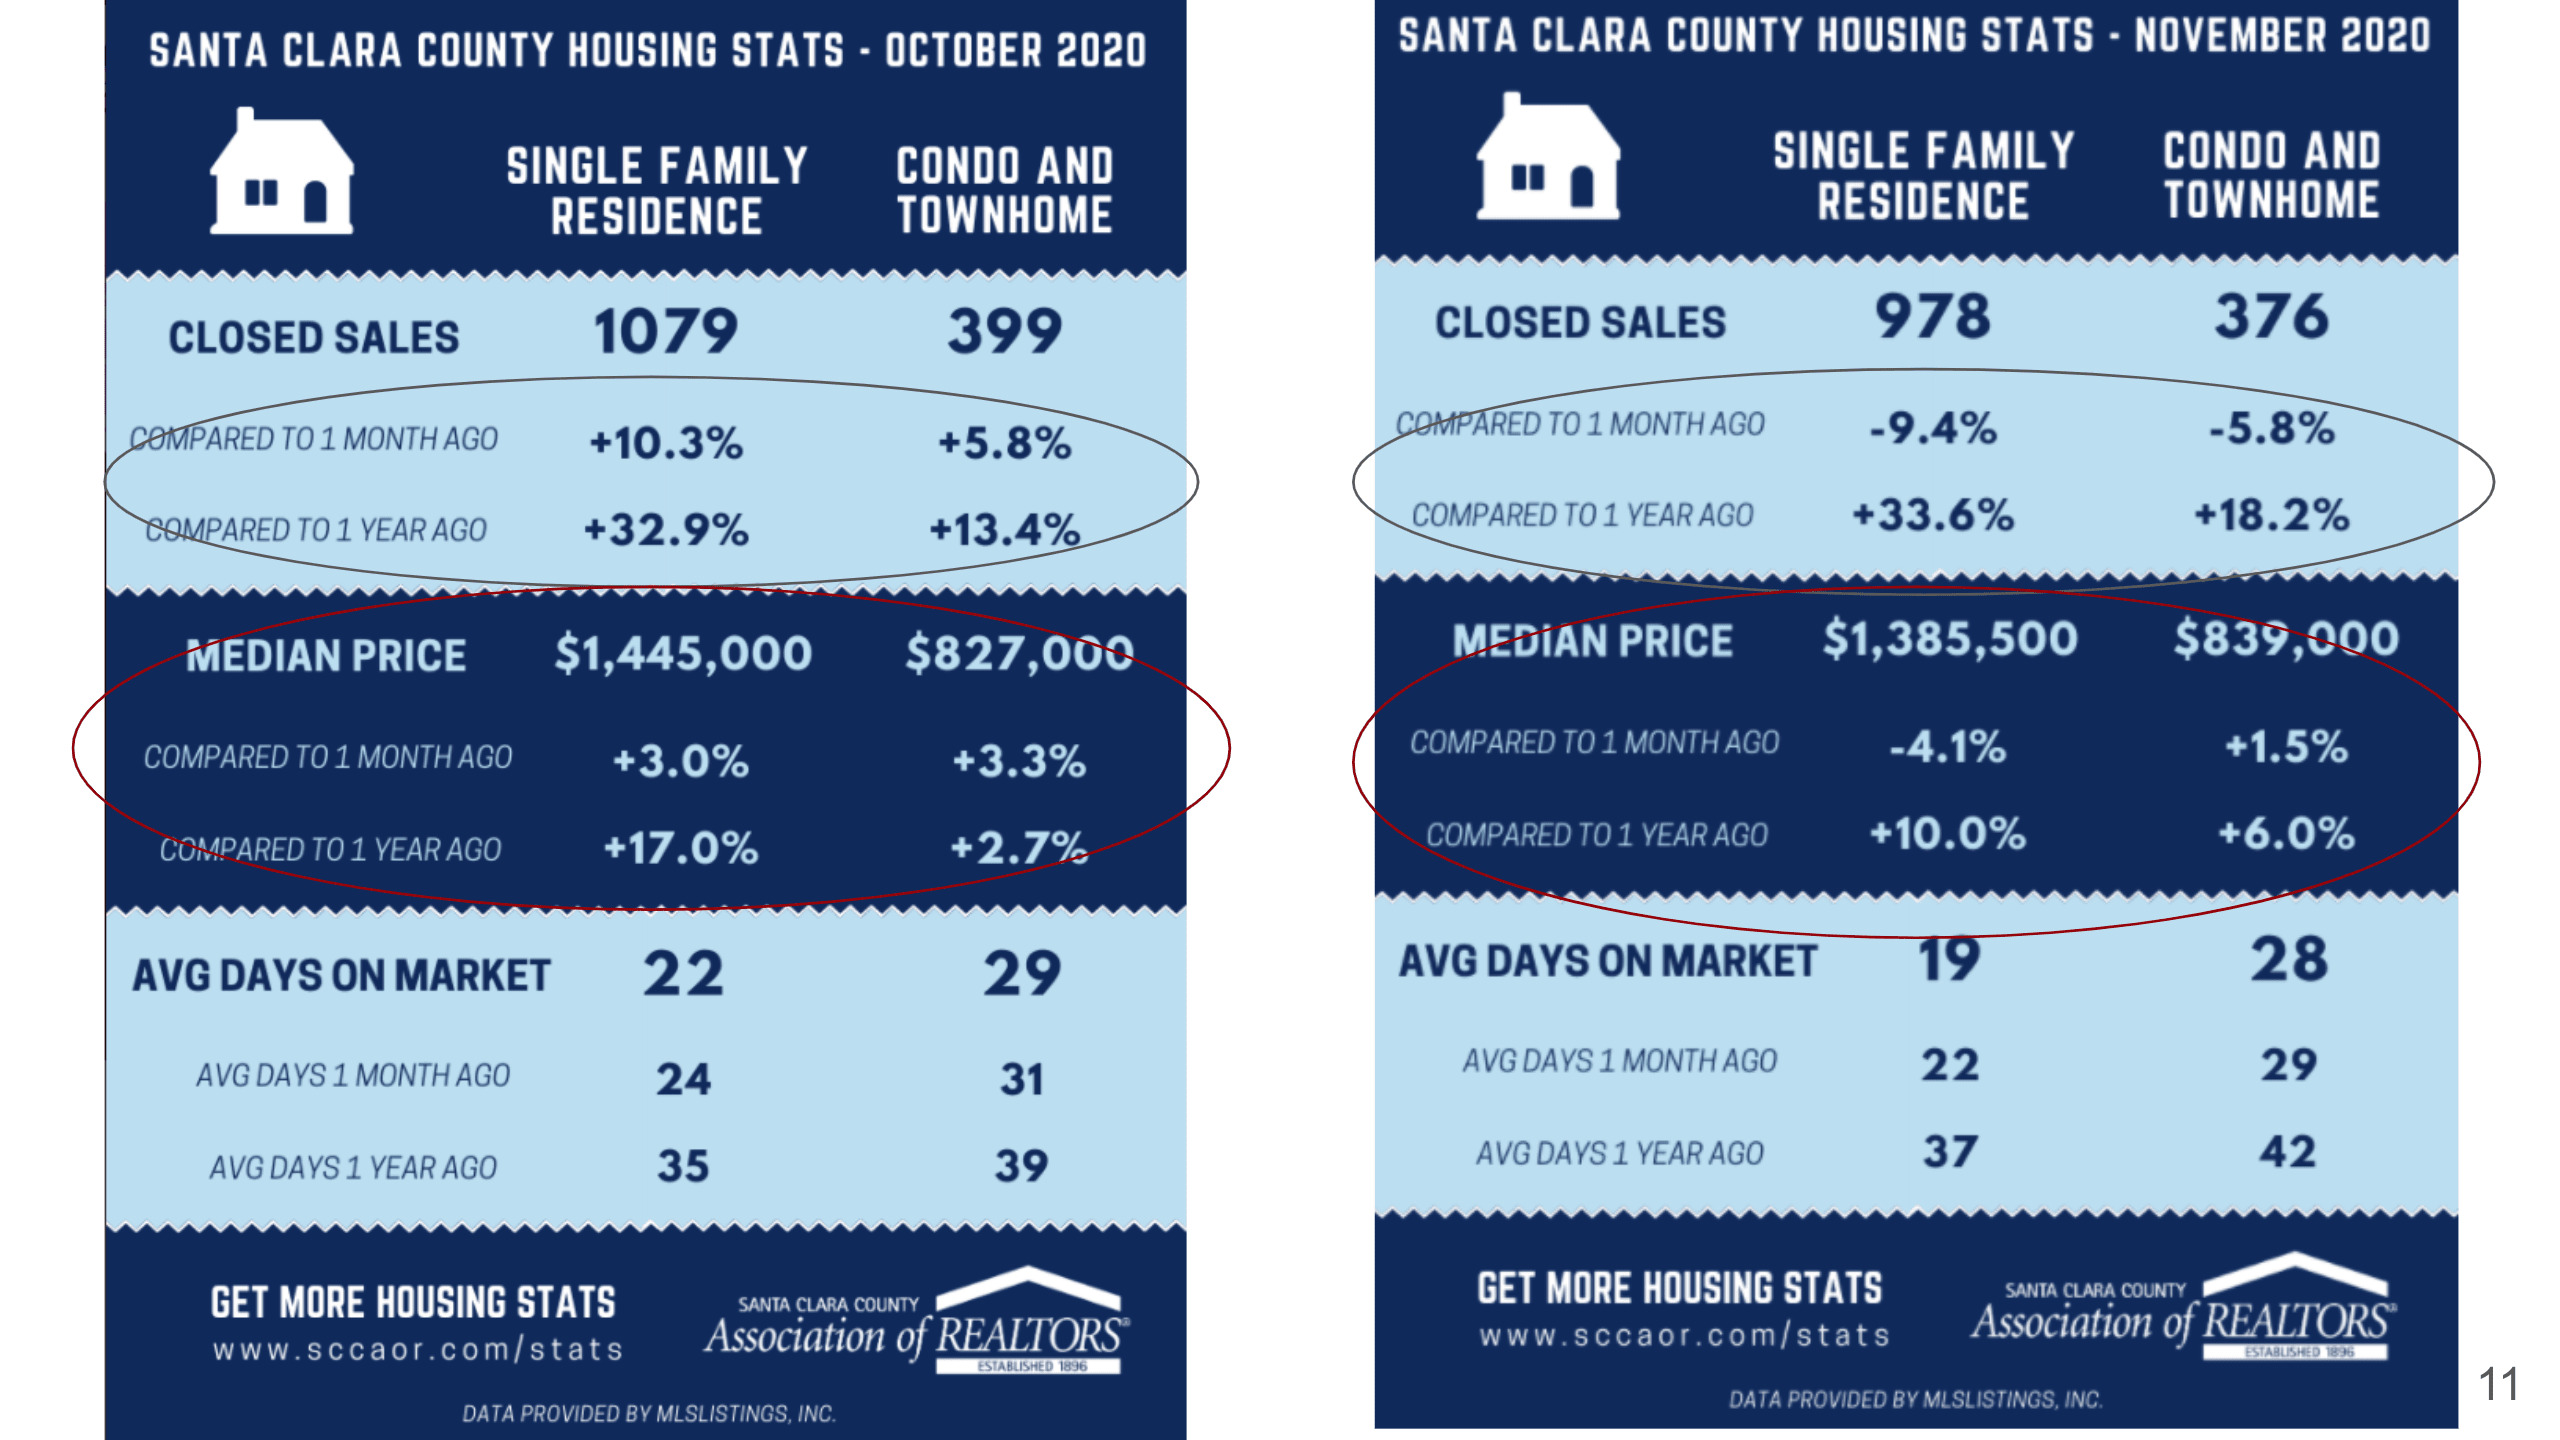
Here let’s compare the data in Santa Clara County from October and November. For single family homes, we saw that there were a lot more close sales in October, and it actually dropped a little bit in November. But again, compared to last year, it’s 33.6% more, while for townhomes, we are closing about 18.2% percent more. Compared to October though, it did drop, but it’s very normal since it’s November, it definitely is gonna drop a little bit. If we compared it to a normal market like last year, we still have quite a bit of inventory. The median price did go down a little bit. For single family homes, it went down to 1.3855 million, but the condo prices actually went up a little bit to $839,000. Again, if you compared to a year ago, single family homes have gone up 10%, and condos and townhomes have gone up 6% in price. As for the average days on the market, October was 22 days, and November was 19 days. Both have slightly fewer days on the market, meaning actually selling faster than last year. A year ago in 2019, we mentioned just now that it was a slower market, and it was 37 days and 42 days, so that’s a big difference. 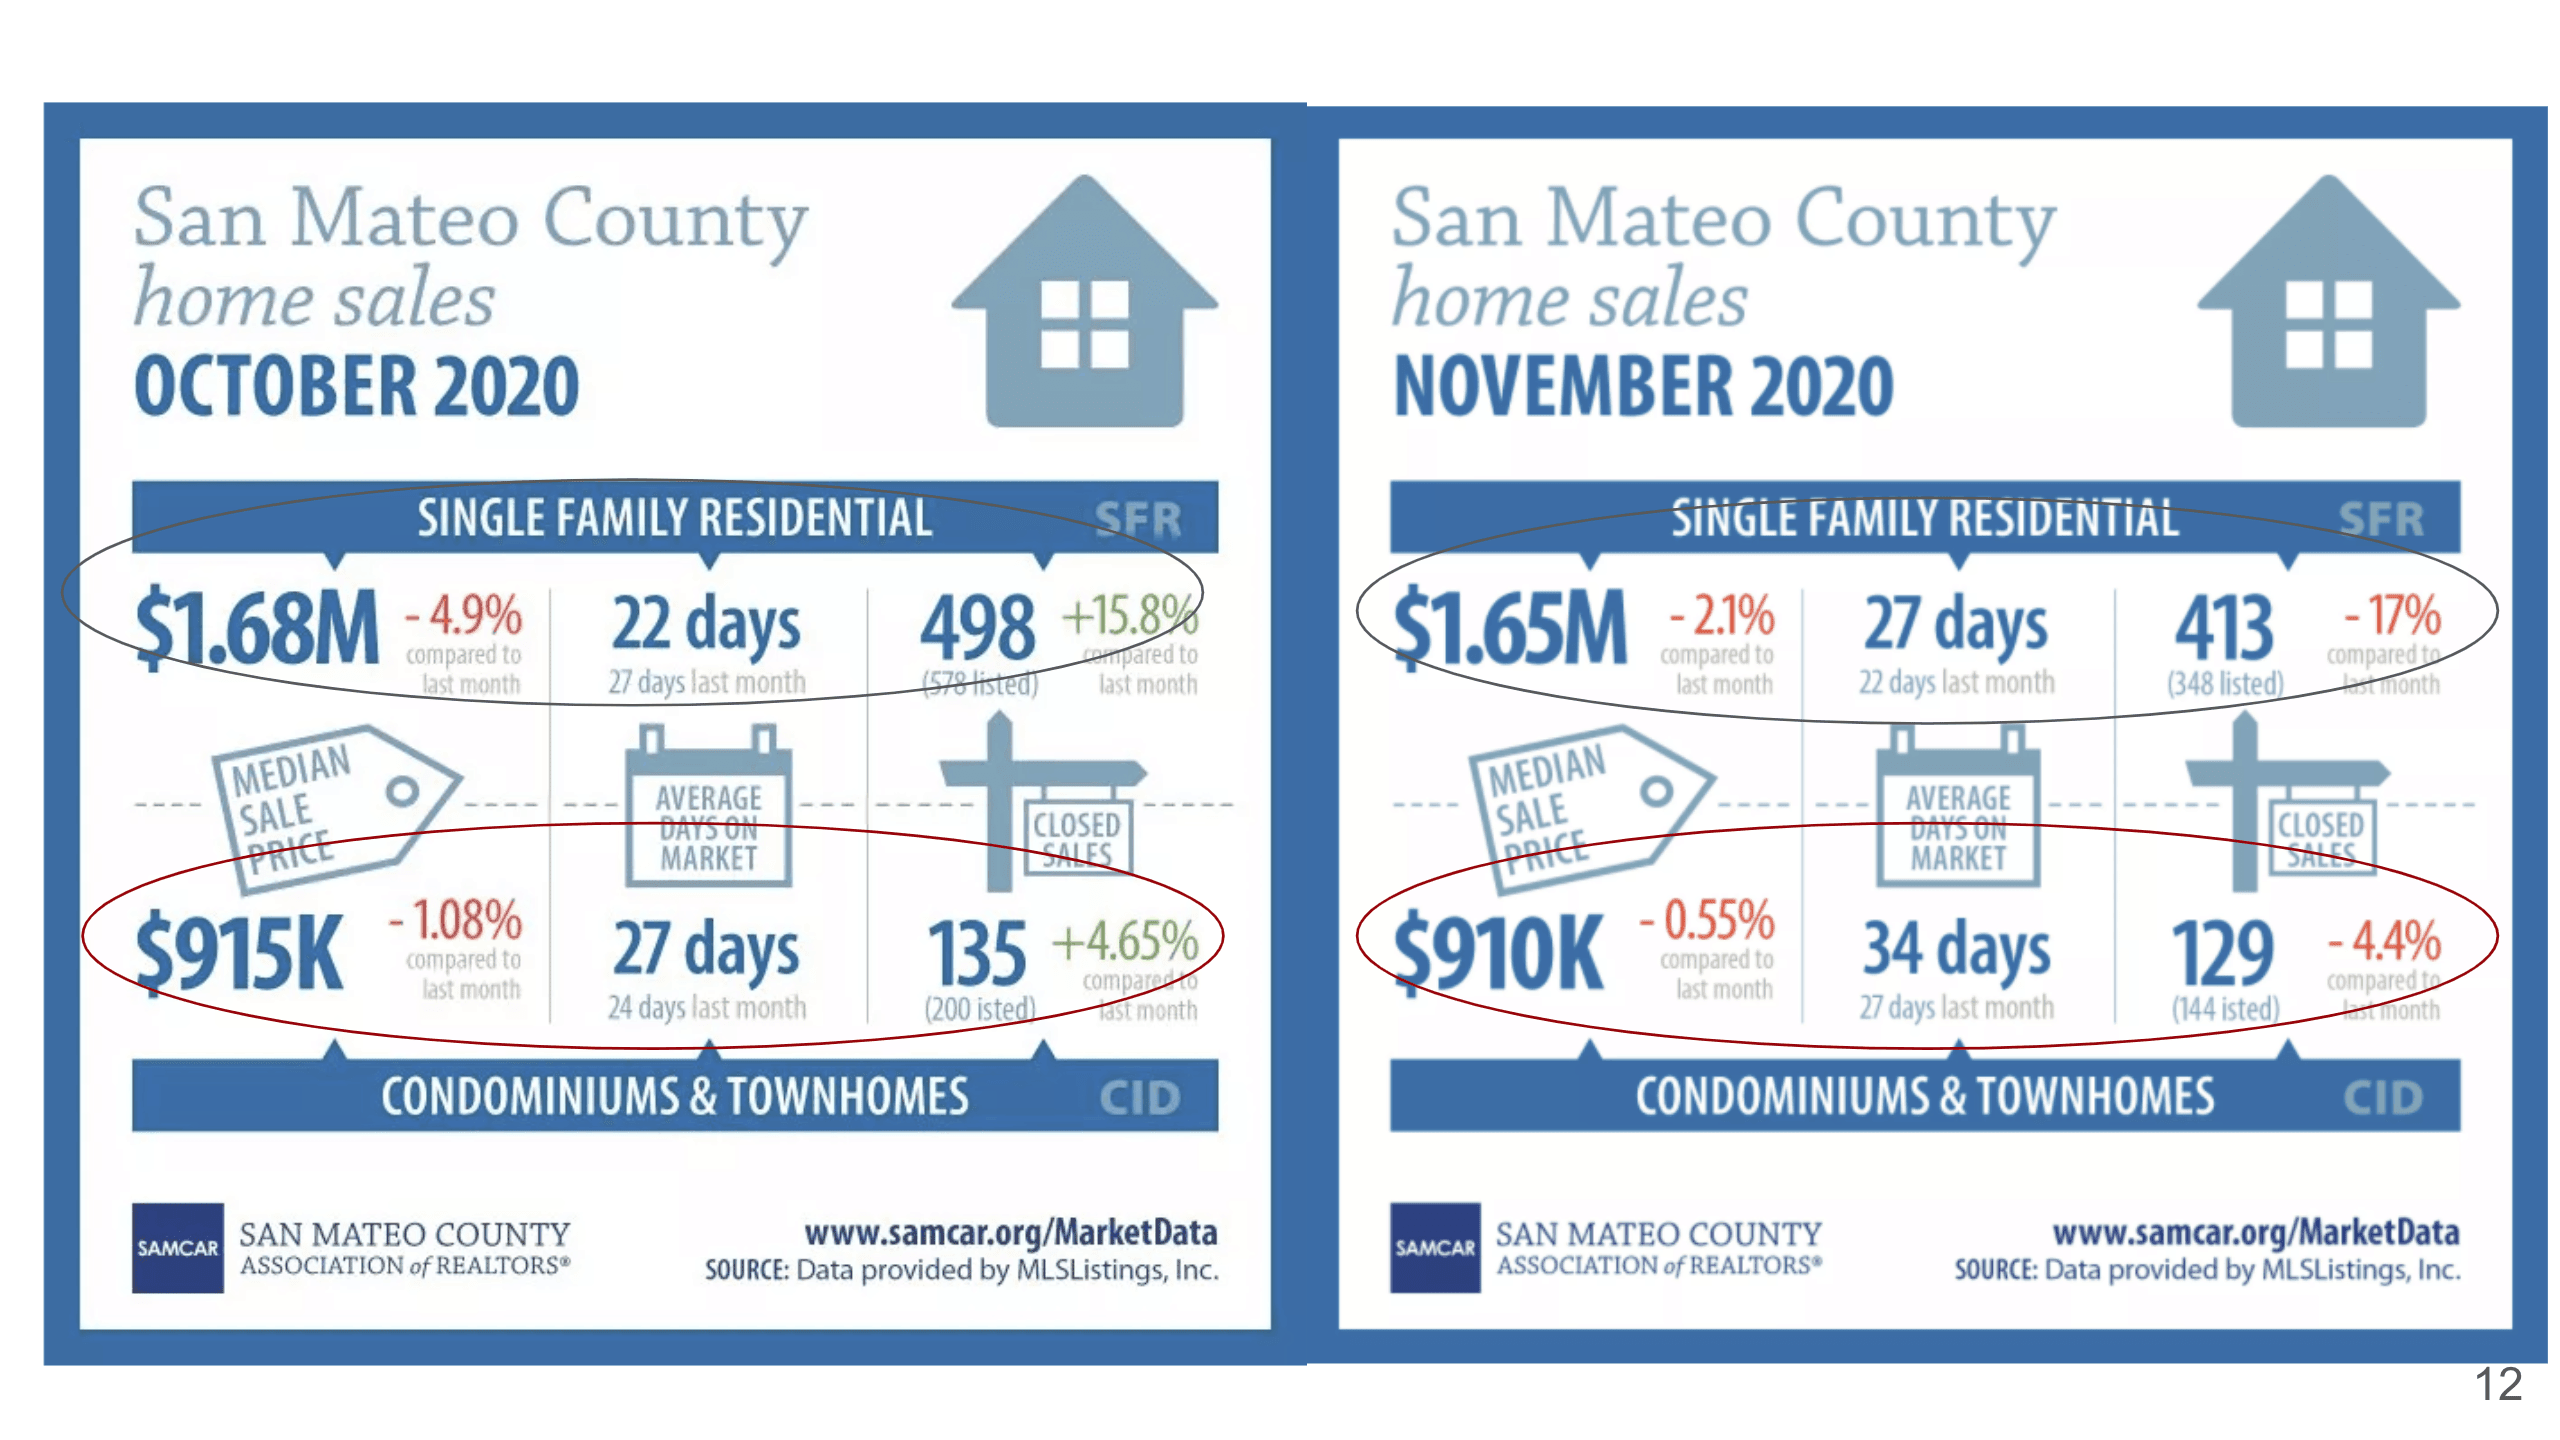
What about San Mateo County? We do see that the price has been coming down month over month for the past few months, and this month the median sales price for single family homes went down again to 1.65 million, and the properties stayed on the market a little bit longer, which is 27 days instead of 22 days from last month. There were fewer properties listed. As for condos, the price also dropped a little bit, properties stayed on the market a bit longer, and there were fewer properties listed on the market as well. It’s also interesting, because typically if we have less inventory, the price should be a little higher, right? Here we actually see that the inventory is a little bit less than last month, but the pricing also came down, and they stayed on the market a bit longer.
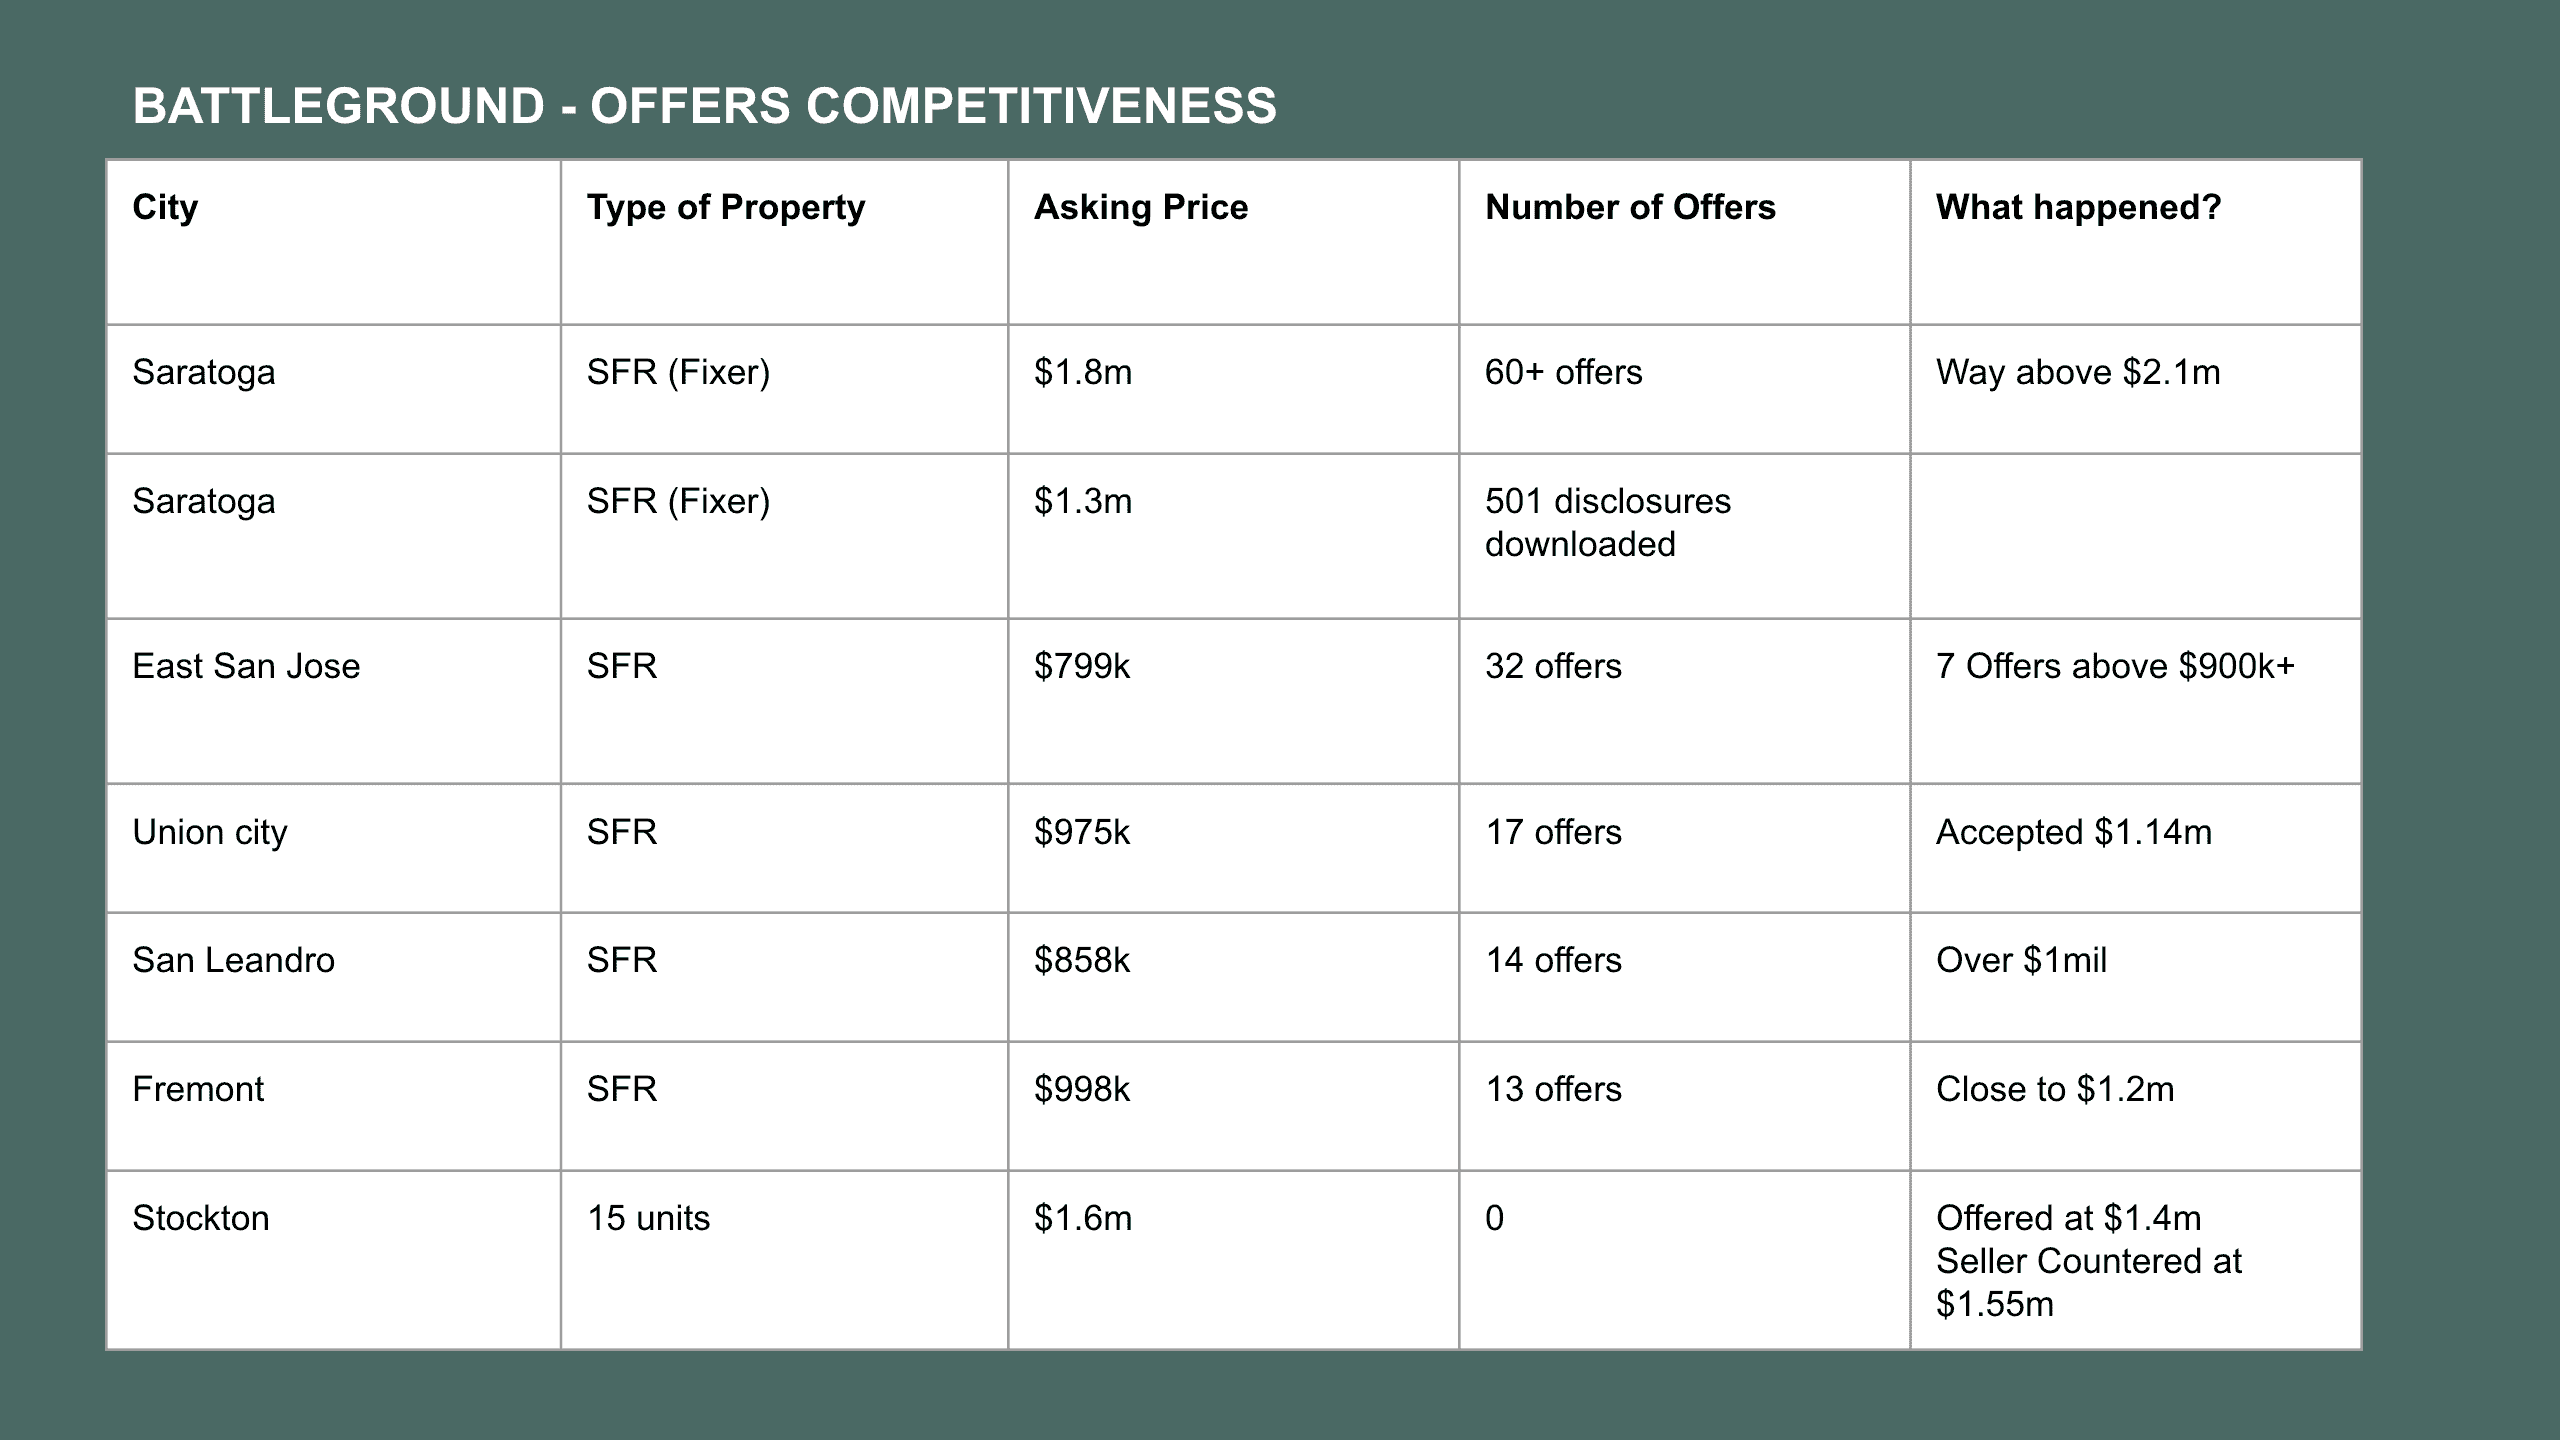
Since I wasn’t able to give you a lot of information on East Bay, I thought why not share with you the actual offer competition in our battleground. I picked just a few properties for you to see, so you can get an idea of how competitive this market is. For example, in Saratoga, which is in Santa Clara County, a single family (fixer) home was asking for 1.8 million dollars, and another one was asking 1.3 million dollars. The 1.8 million fixer got 60+ offers, and the agent said it was way above 2.1 million dollars. The next one is even crazier, 1.3 million dollars asking price in Saratoga is very very low, this is a probate sale, and they had 501 disclosures downloaded. That’s how many people are looking to buy in Saratoga. These two cases just blew our minds away – that’s a lot of people trying to bid.
What about east San Jose? The same thing. This single family home has an asking price of $799k, they got 32 offers, and then there were seven offers above $900k. We don’t know what it’s going for at this point, because this just went under contract. Union City single family home, asking price was $975k, got 17 offers, and accepted an offer at 1.14 million. San Leandro, East Bay, single family again the asking price was $858k, they got 14 offers, and went over a million dollar. Then Fremont, this is a single family asking $998k, received 13 offers, and then it accepted something close to 1.2 million dollars. Now, what about multi-family? Stockton, 15 units, asking 1.6 million, didn’t get any offer, so we submitted something offering at 1.4 million, seller countered back at 1.55 million. This is just an example, what we’ve been talking about is that multi-family buyers or investors right now are very careful when they make an offer. They want to be very conservative, but then the sellers are very much sticking with their numbers, so there is definitely a gap between what the buyers want and what the sellers want in the multi-family market. So I thought this would be quite interesting for you to look at because these are real cases and real offers that we helped some of our clients to make just in the past few weeks.
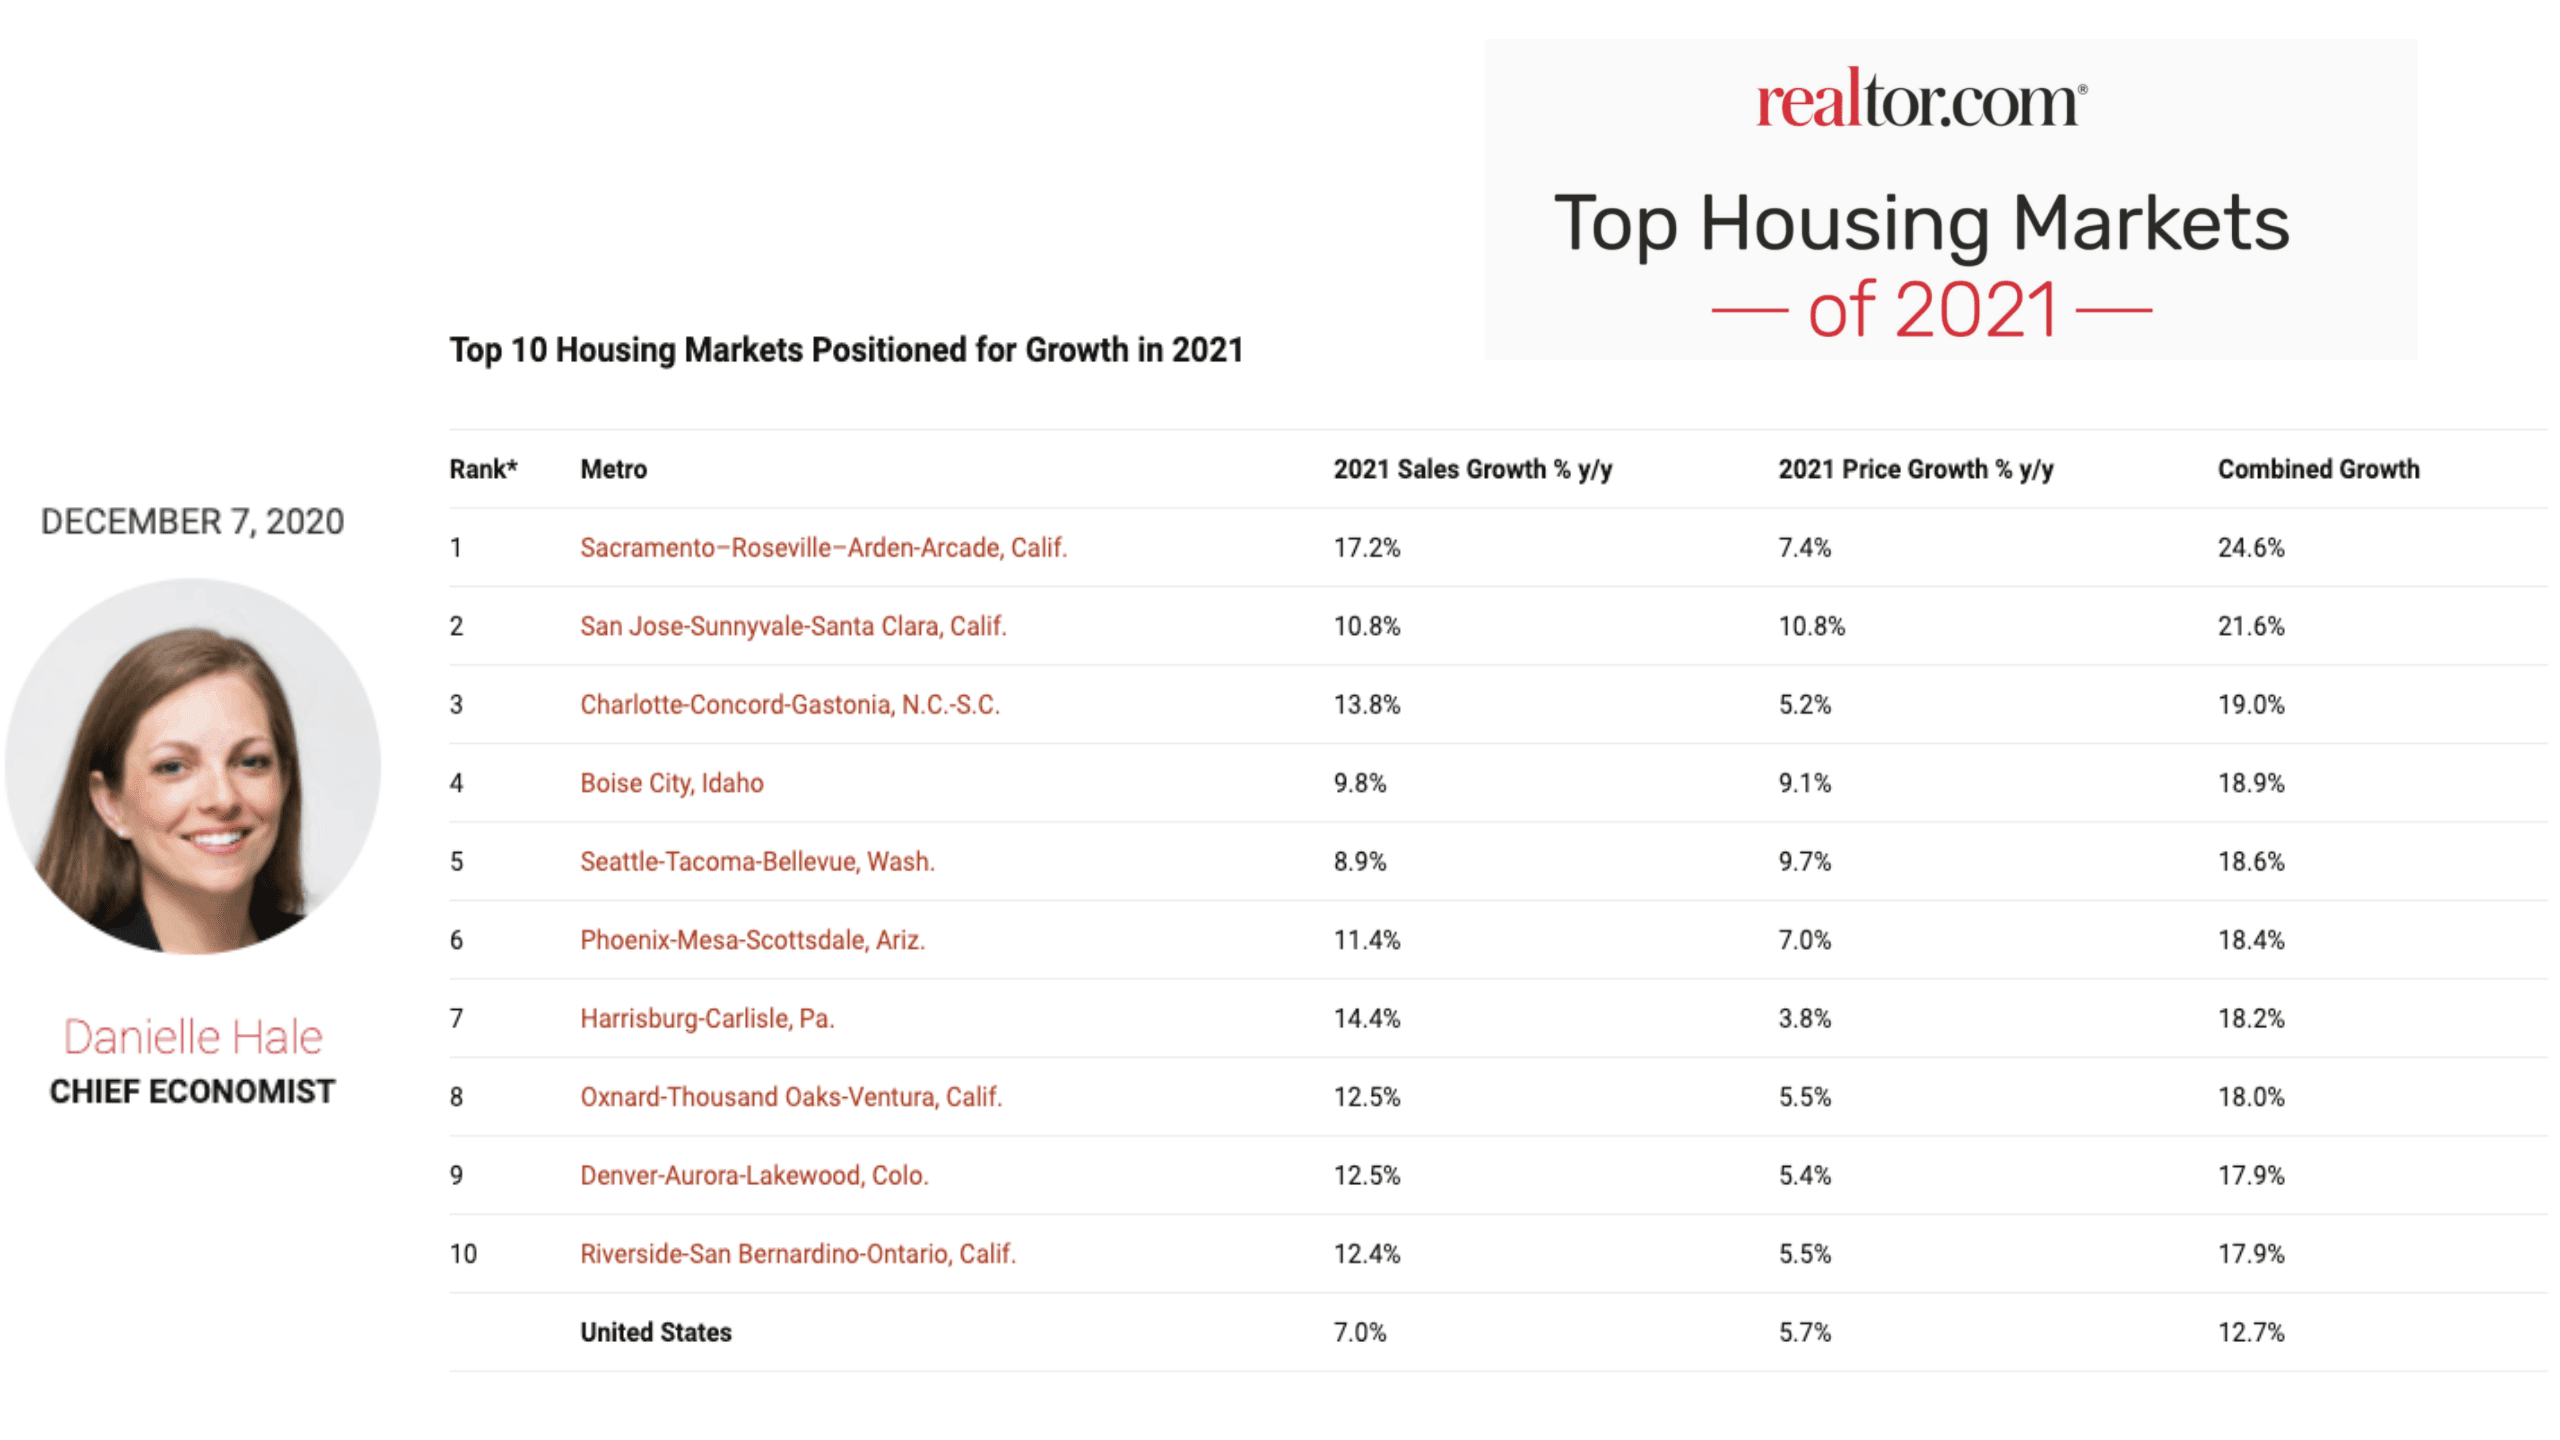
All right, so let’s look at what realtor.com they are saying. If some of you are trying to look for a market to invest in, here are the top 10 housing markets that Danielle Hale, Chief Economist for realtor.com, had recommended. Surprisingly, two of them are in California, even though so many people are saying that the price has gone up so much, it’s too crazy, but look at that – number one is Sacramento, that’s what she’s recommending because she believes that 2021 is going to continue to go up. San Jose, the Silicon Valley 10.8%, Charlotte 13.8%, etc. These are the markets that the chief economist at realtor.com is recommending, saying that these are great markets positioned for growth. We are absolutely excited to hear that the San Jose-Sunnyvale-Santa Clara area is still one of the strongest markets.
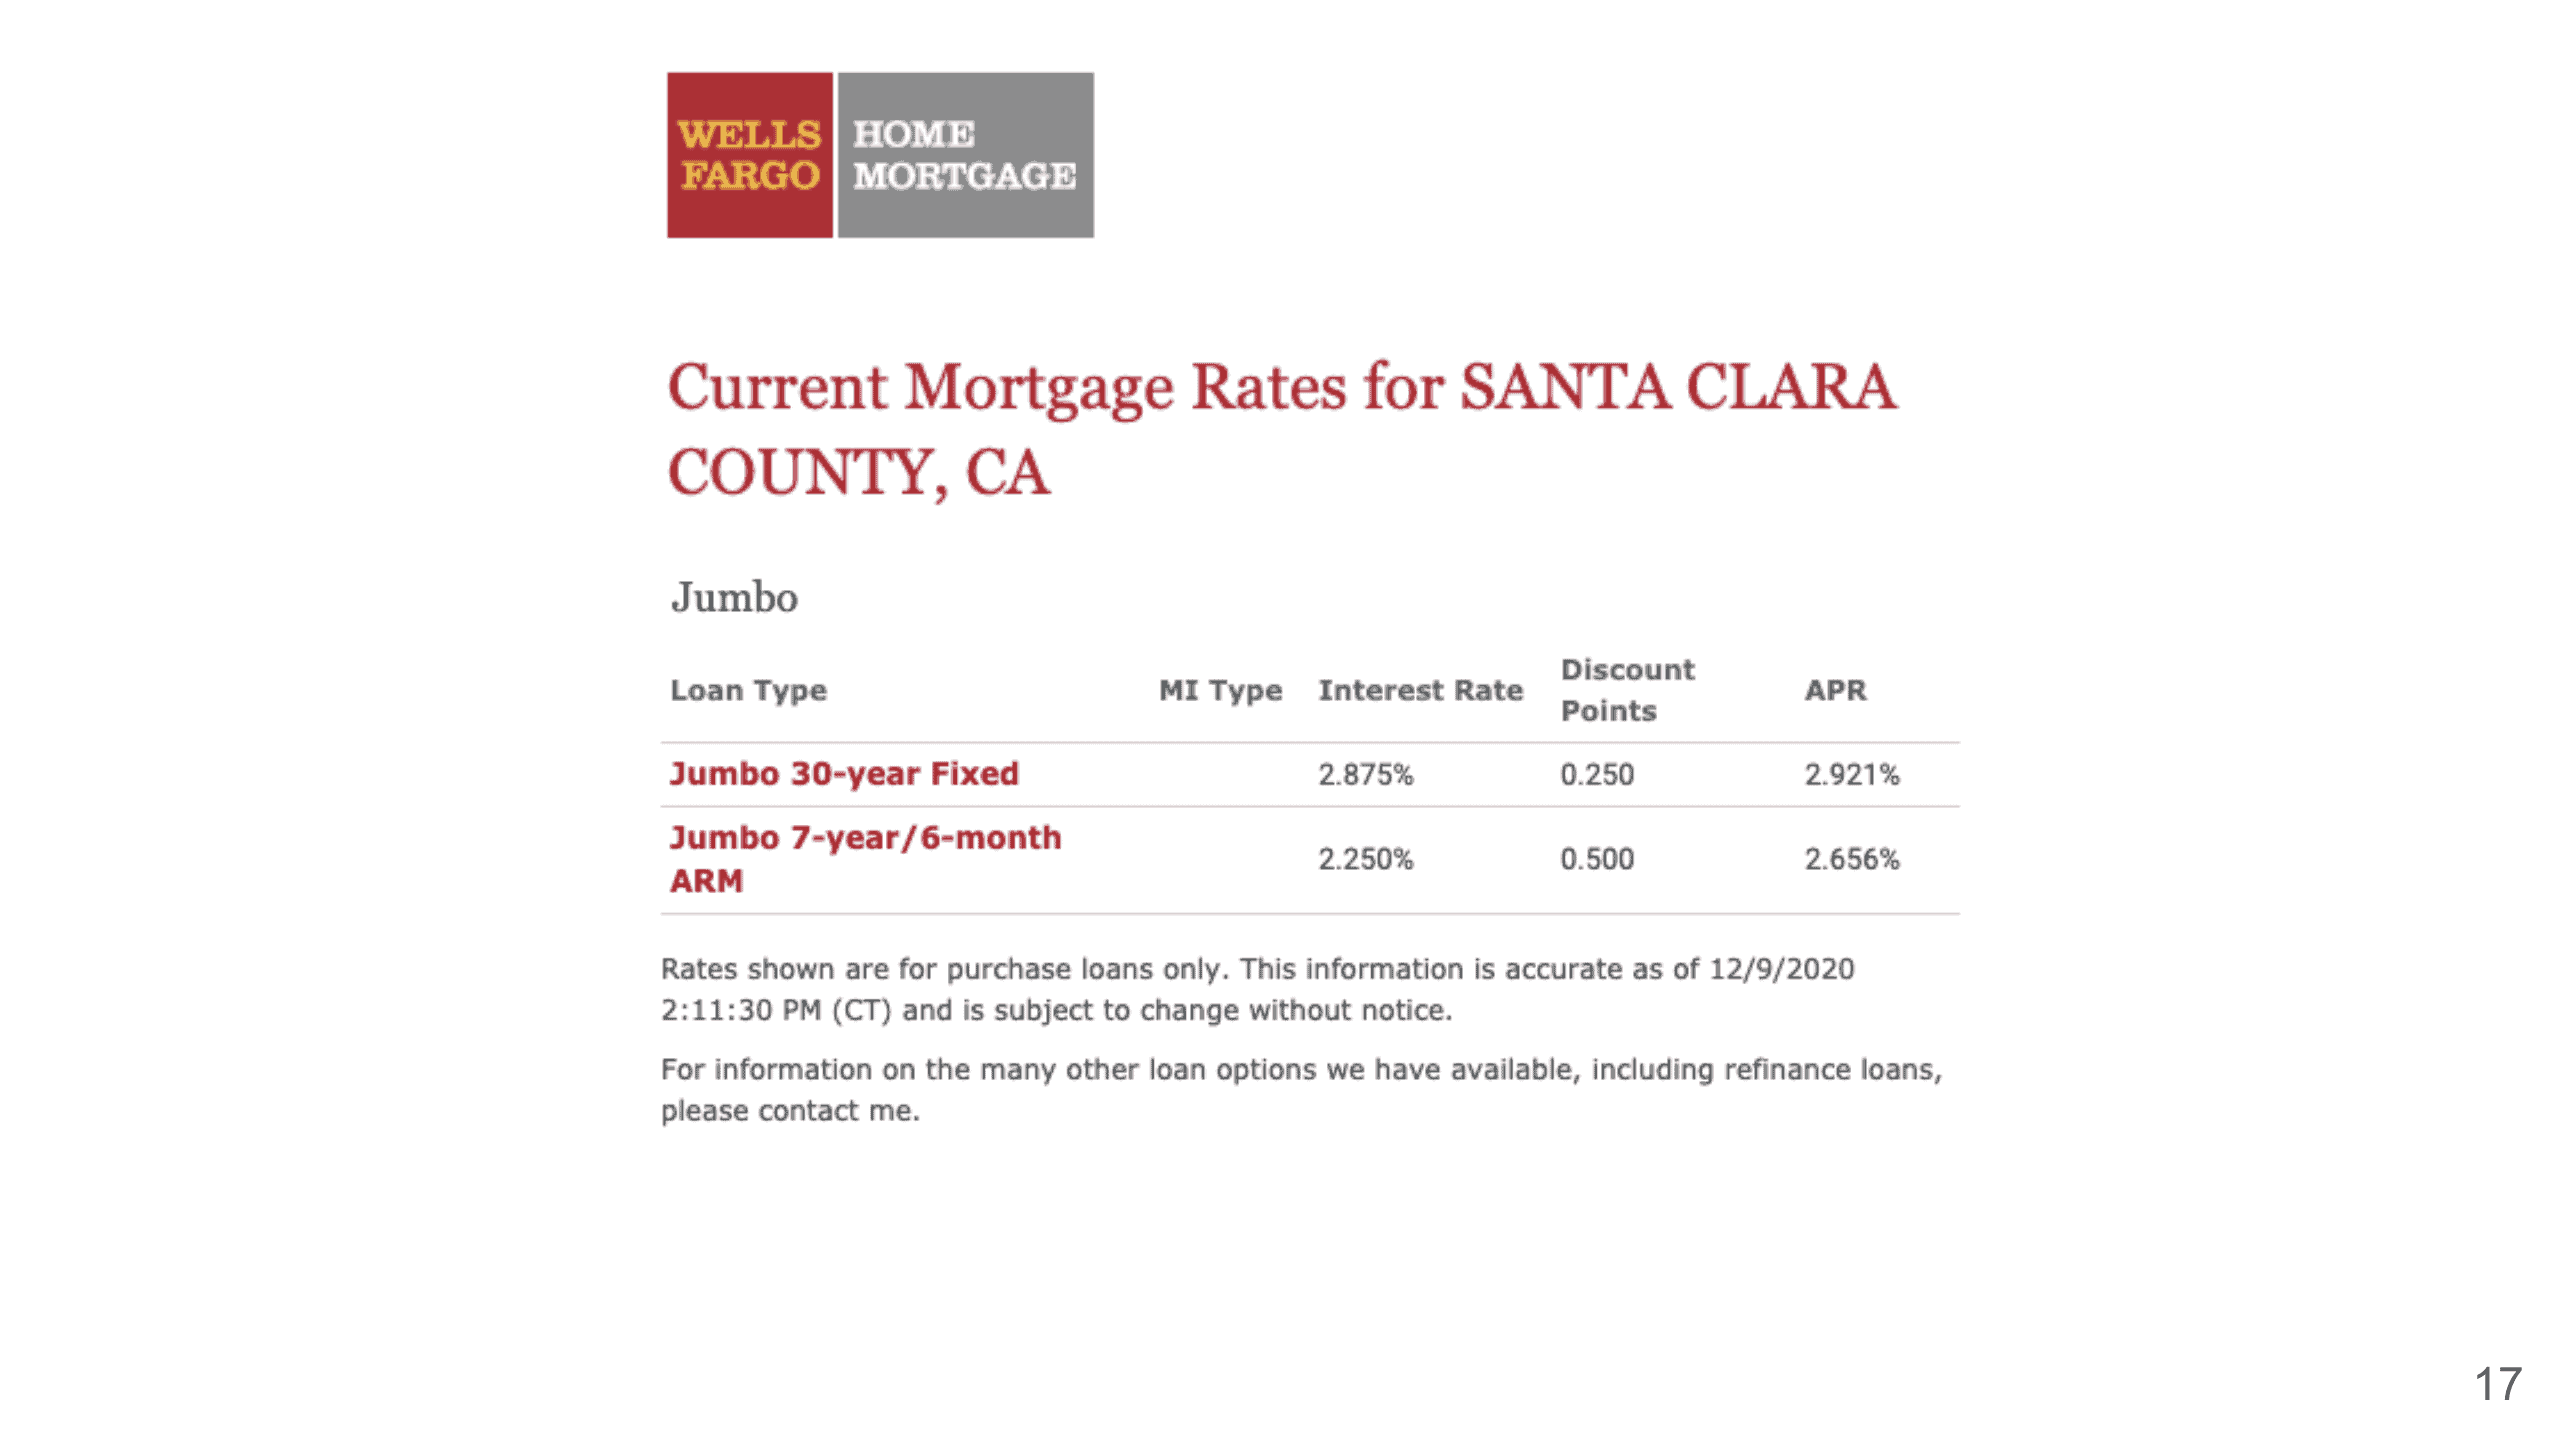
What about the loan situation? The mortgage rate has been staying pretty low at 2.875% for a 30 year fixed jumbo loan in Santa Clara County. Again, sometimes we have clients saying that they got some quotes at a very low rate. Be sure that the first question to ask is what the APR is, because they can be charging you a lot of fees, and APR is your rate plus some of the fees that they charge for the interest rate, and that actually determines how much it is. So this is 2.875%, APR is 2.921%, but if someone else is offering 2.5%, and the APR is 2.95%, then you know it’s actually more expensive than this one. So I just want to make sure that everybody understands when you get a quote from a loan officer, make sure to ask about the fees or the APR.
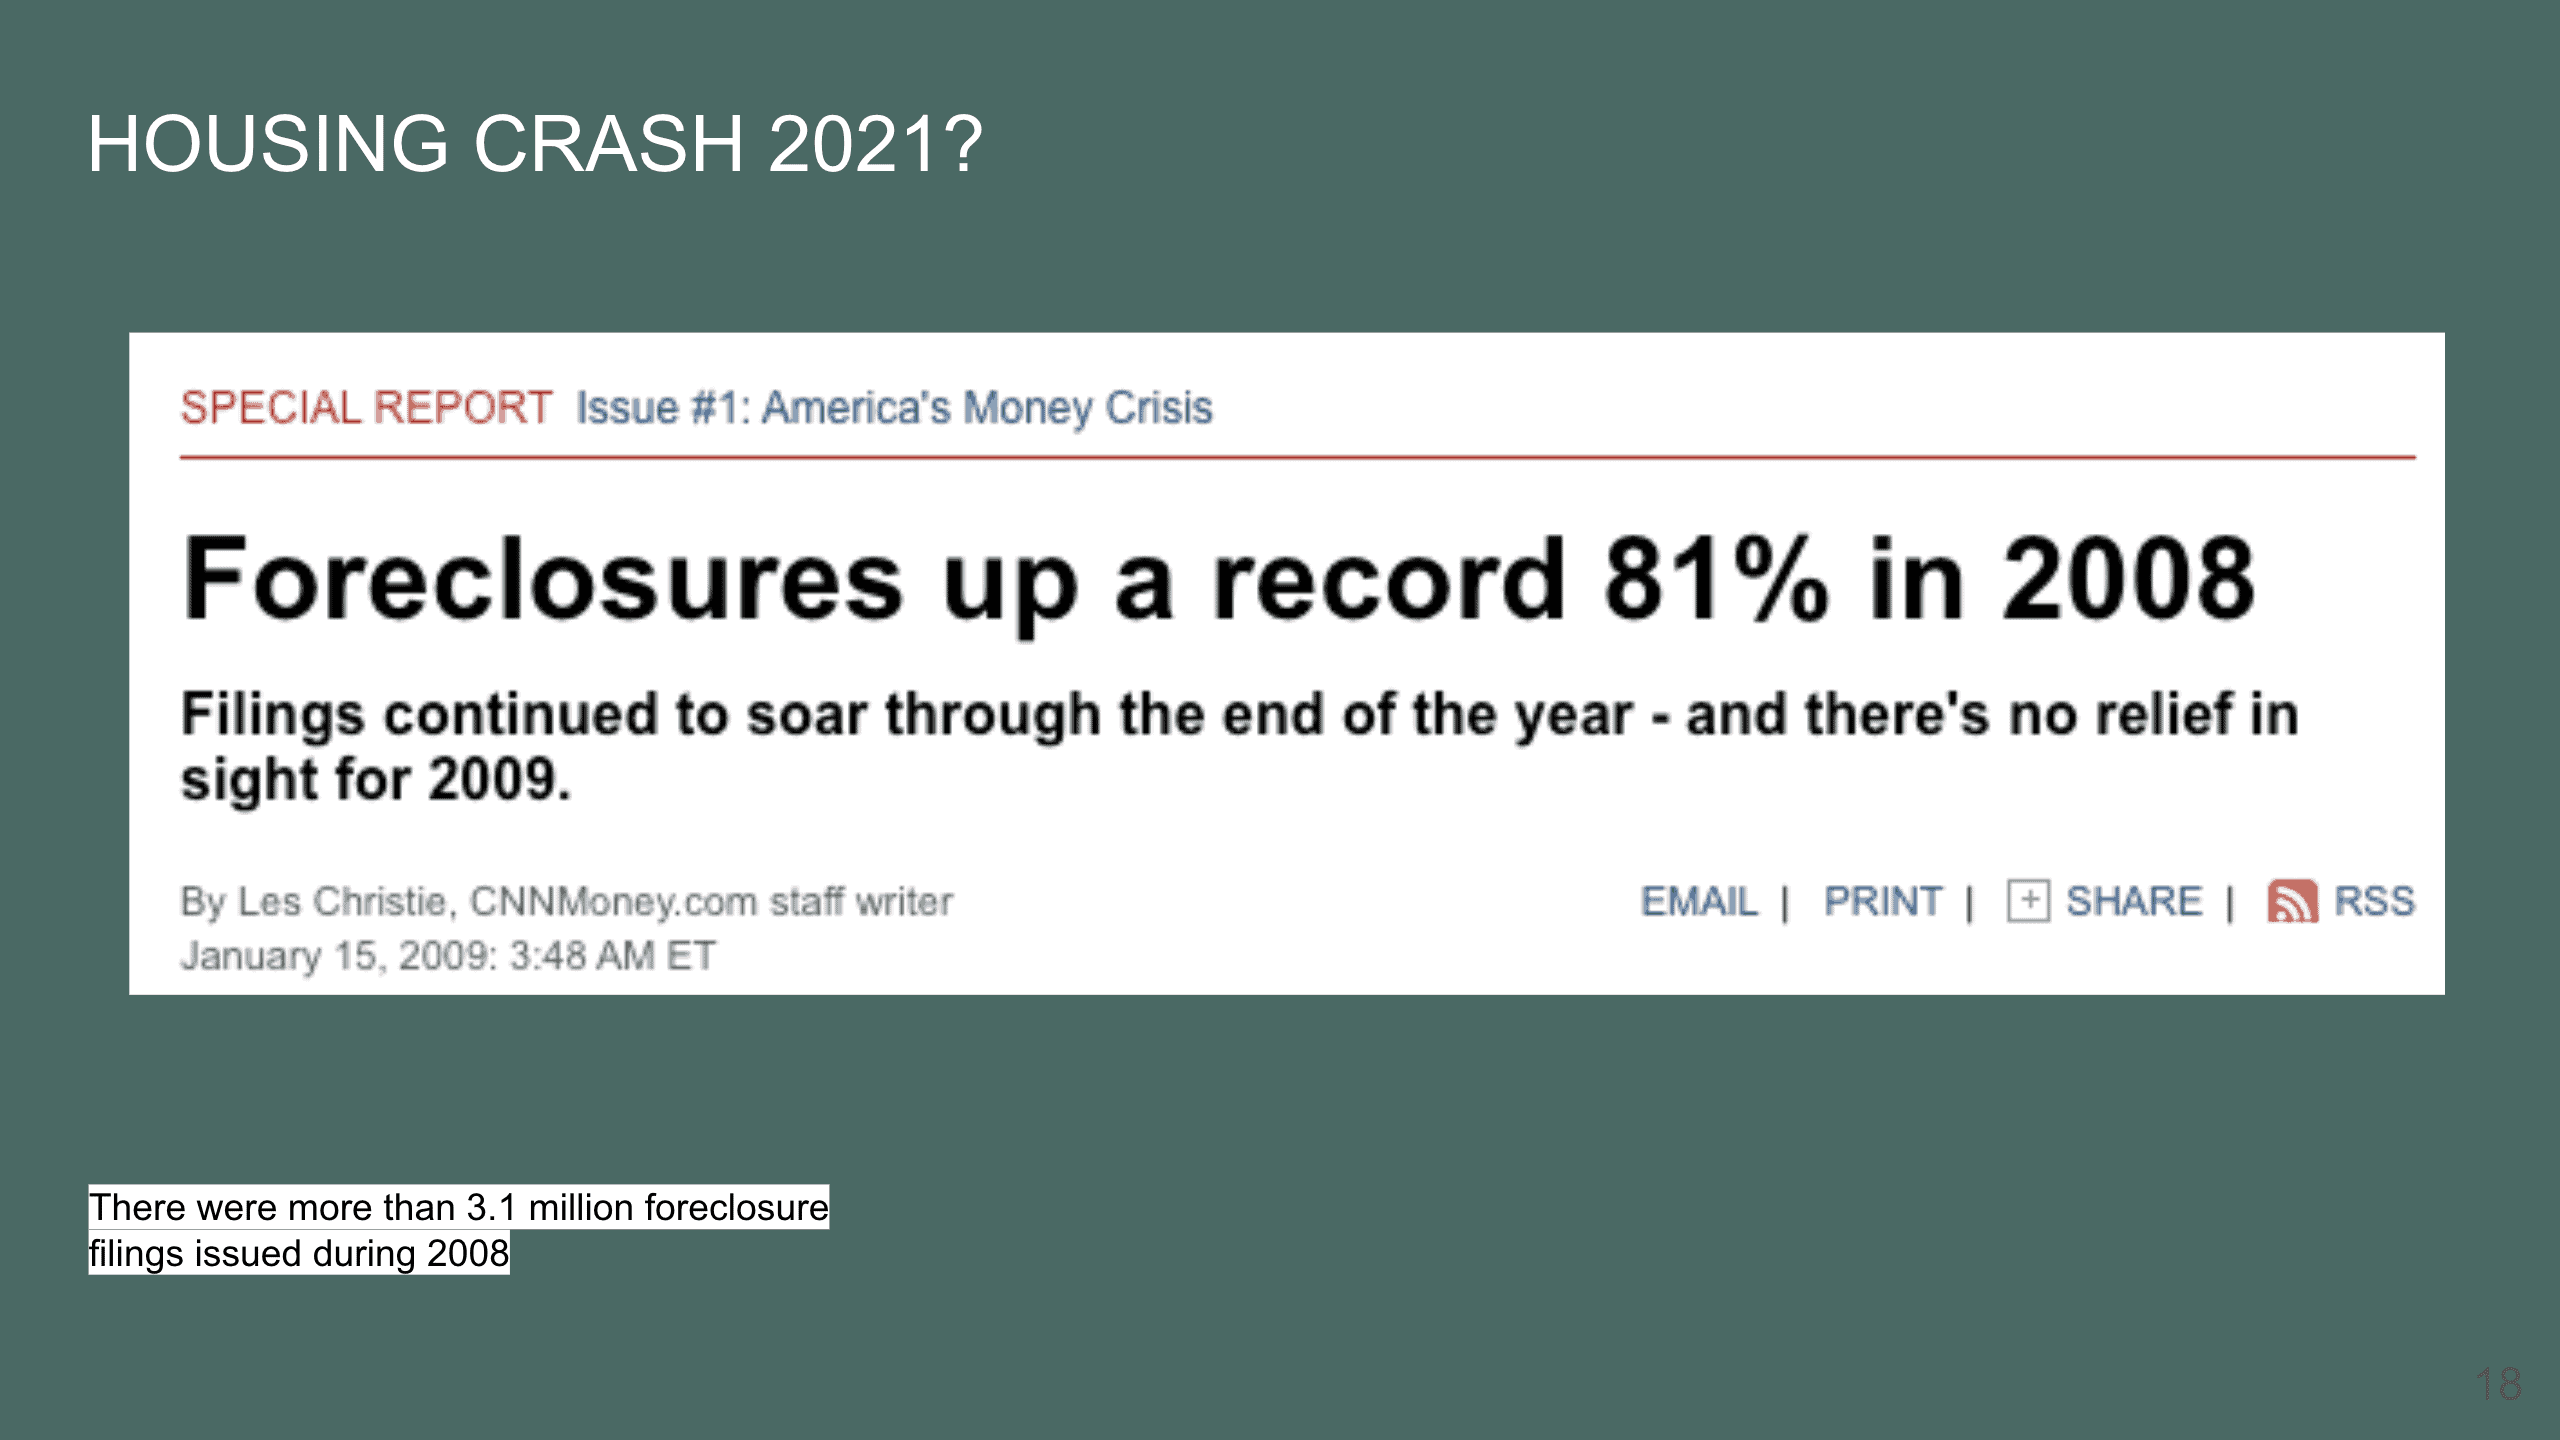
So is the housing gonna crash in 2021? I know I just talked about the great housing markets that realtor.com had mentioned, but, you know, I see people keep talking about how there’s gonna be a housing crash in 2021. I don’t know how many of you have experienced that 2008 market, and I thought about it, I was like – wow that’s actually 12 years ago, but to me, it feels like it just happened. At the time, I remember that I was very shocked about the foreclosures. Look at this article from 2009, it says that the foreclosure was up a record 81%. I was already in the real estate industry, and I can tell you that at that time almost 100% of my deals were either foreclosures, pre-foreclosures, or short sales, rarely ever would we see anything like a regular sale on the market, that was how bad it was at the time. This article was saying that there were more than 3.1 million foreclosure filings issued in 2008.
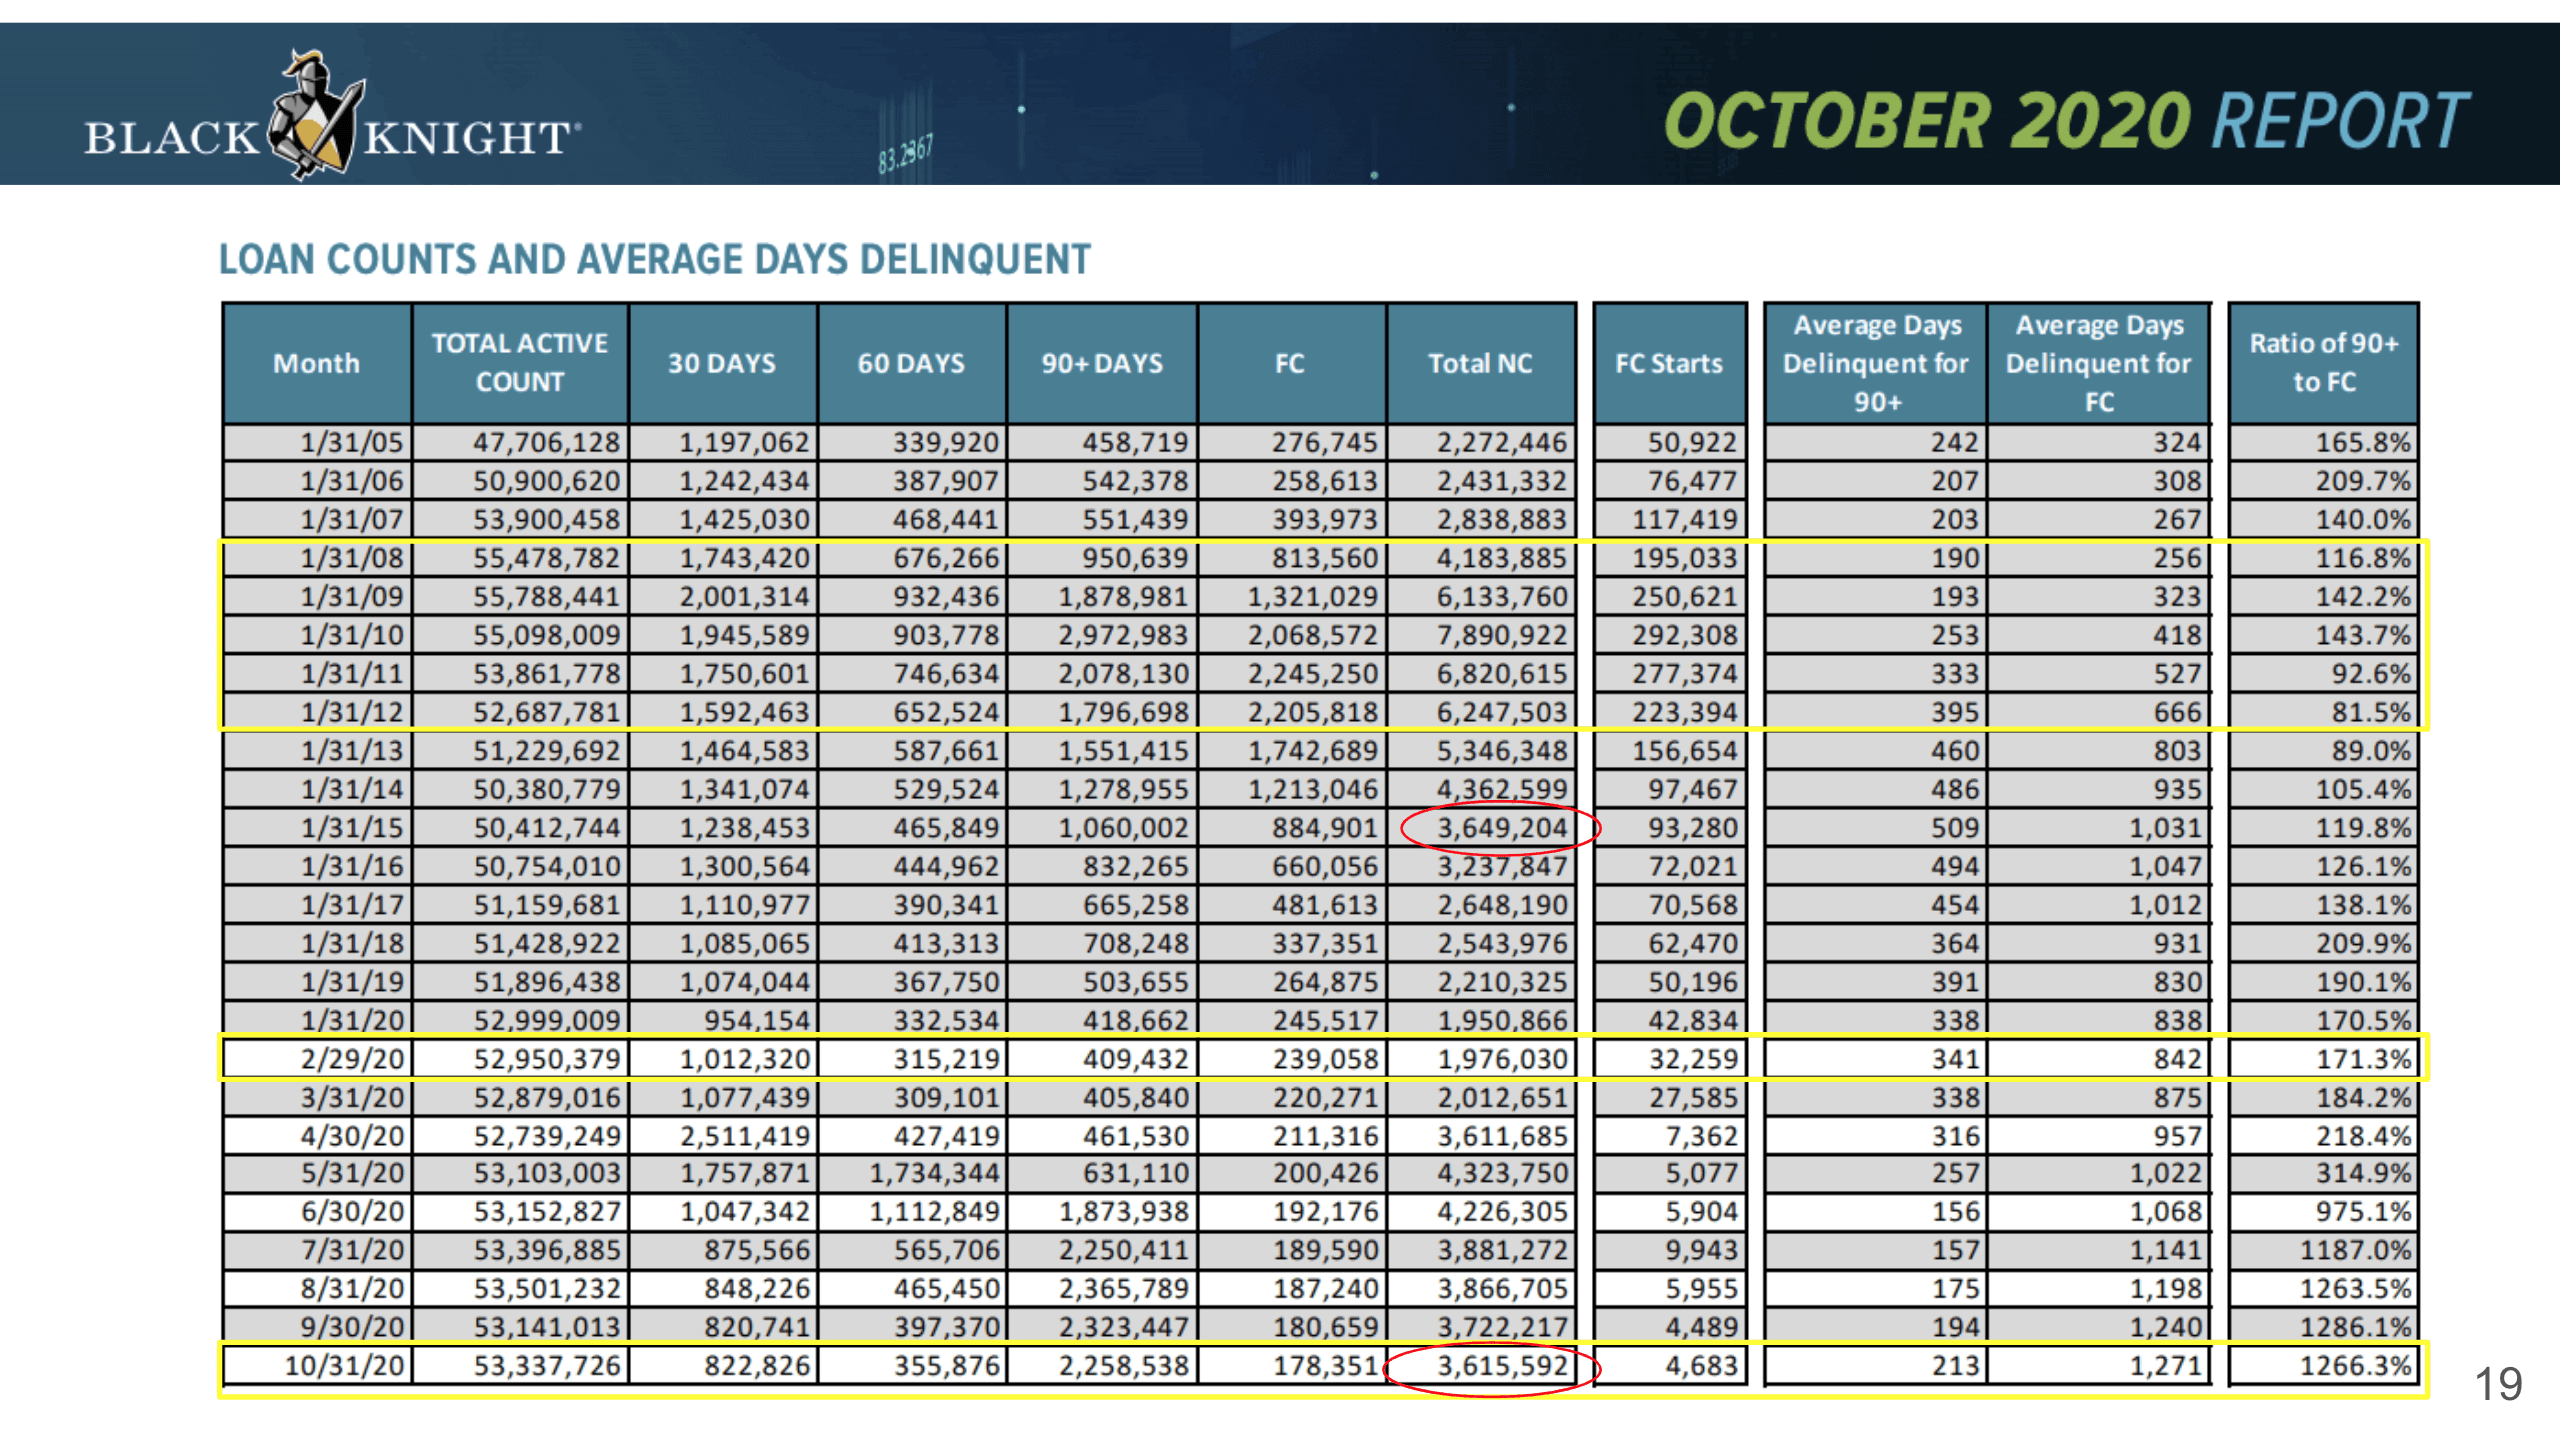
So how does it compare to how our market is right now? Let’s take a look at this. This is Black Knight’s October 2020 Report. You’ll see that the data in the top yellow box is from 2008 to 2012, during that recession. The total number of non-current loan files during that time was on average about 6 million out of 50 something million loans on the market, so that’s quite a bit. Then if you look at where we are right now, we still have about 53 million loans on the market and we have 3.6 million non-current loans as of October 31st. If you look at right before COVID, on February 29th we had about almost two million non-current loans, which is really low, that’s pretty much the lowest compared to any other years besides January 2020. We have very few, relatively speaking, non-current loan files on the market. I am not saying that we are doing really good, I’m saying that we have definitely increased quite a bit on the non-current loan files compared to pre-COVID. If we go back to look at the numbers from 2008 to 2012, that kind of foreclosure, which was the main reason why our market crashed, we are not nearly as bad as that time. However, we do have a lot of forbearance on the market right now.
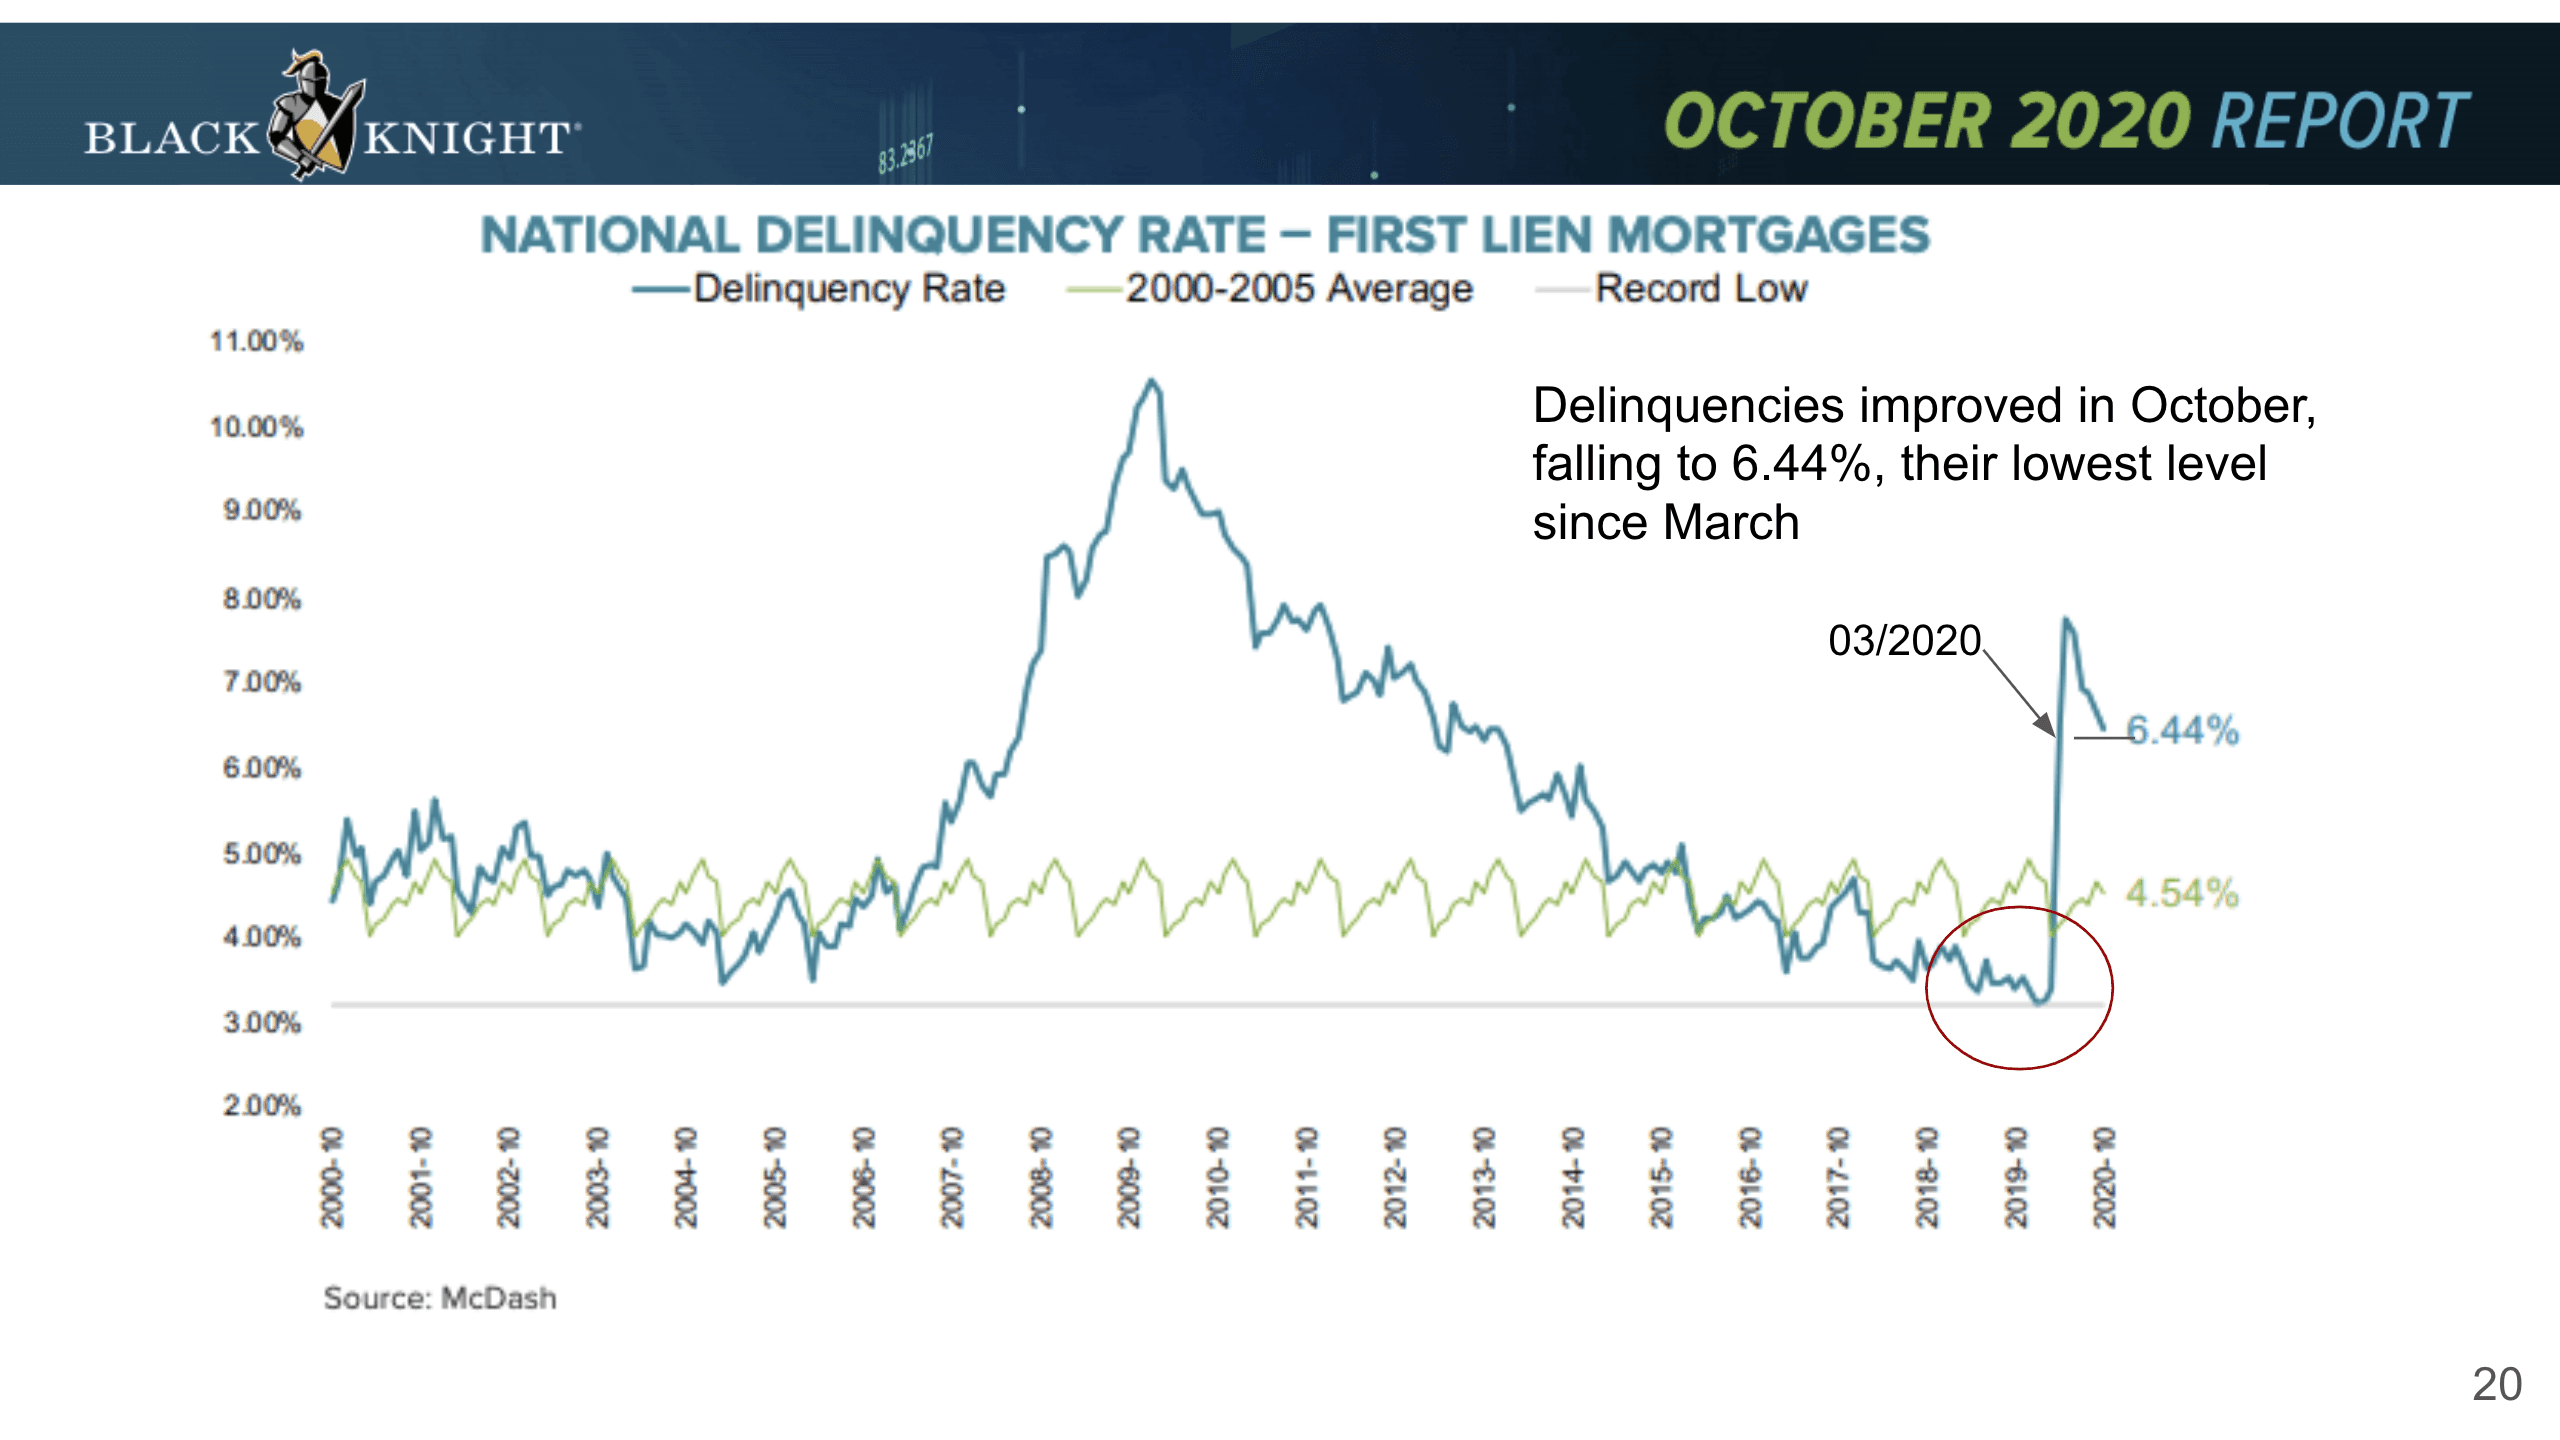
That’s why I would like to share with you the next graph. Here are the national delinquency rates, meaning the rate of people not paying for their mortgage and are delinquent. It did shoot up quite a bit, and then it came back down to 6.44%, the average is 4.54%, so it is definitely high. However, it is actually falling to the lowest level since March.
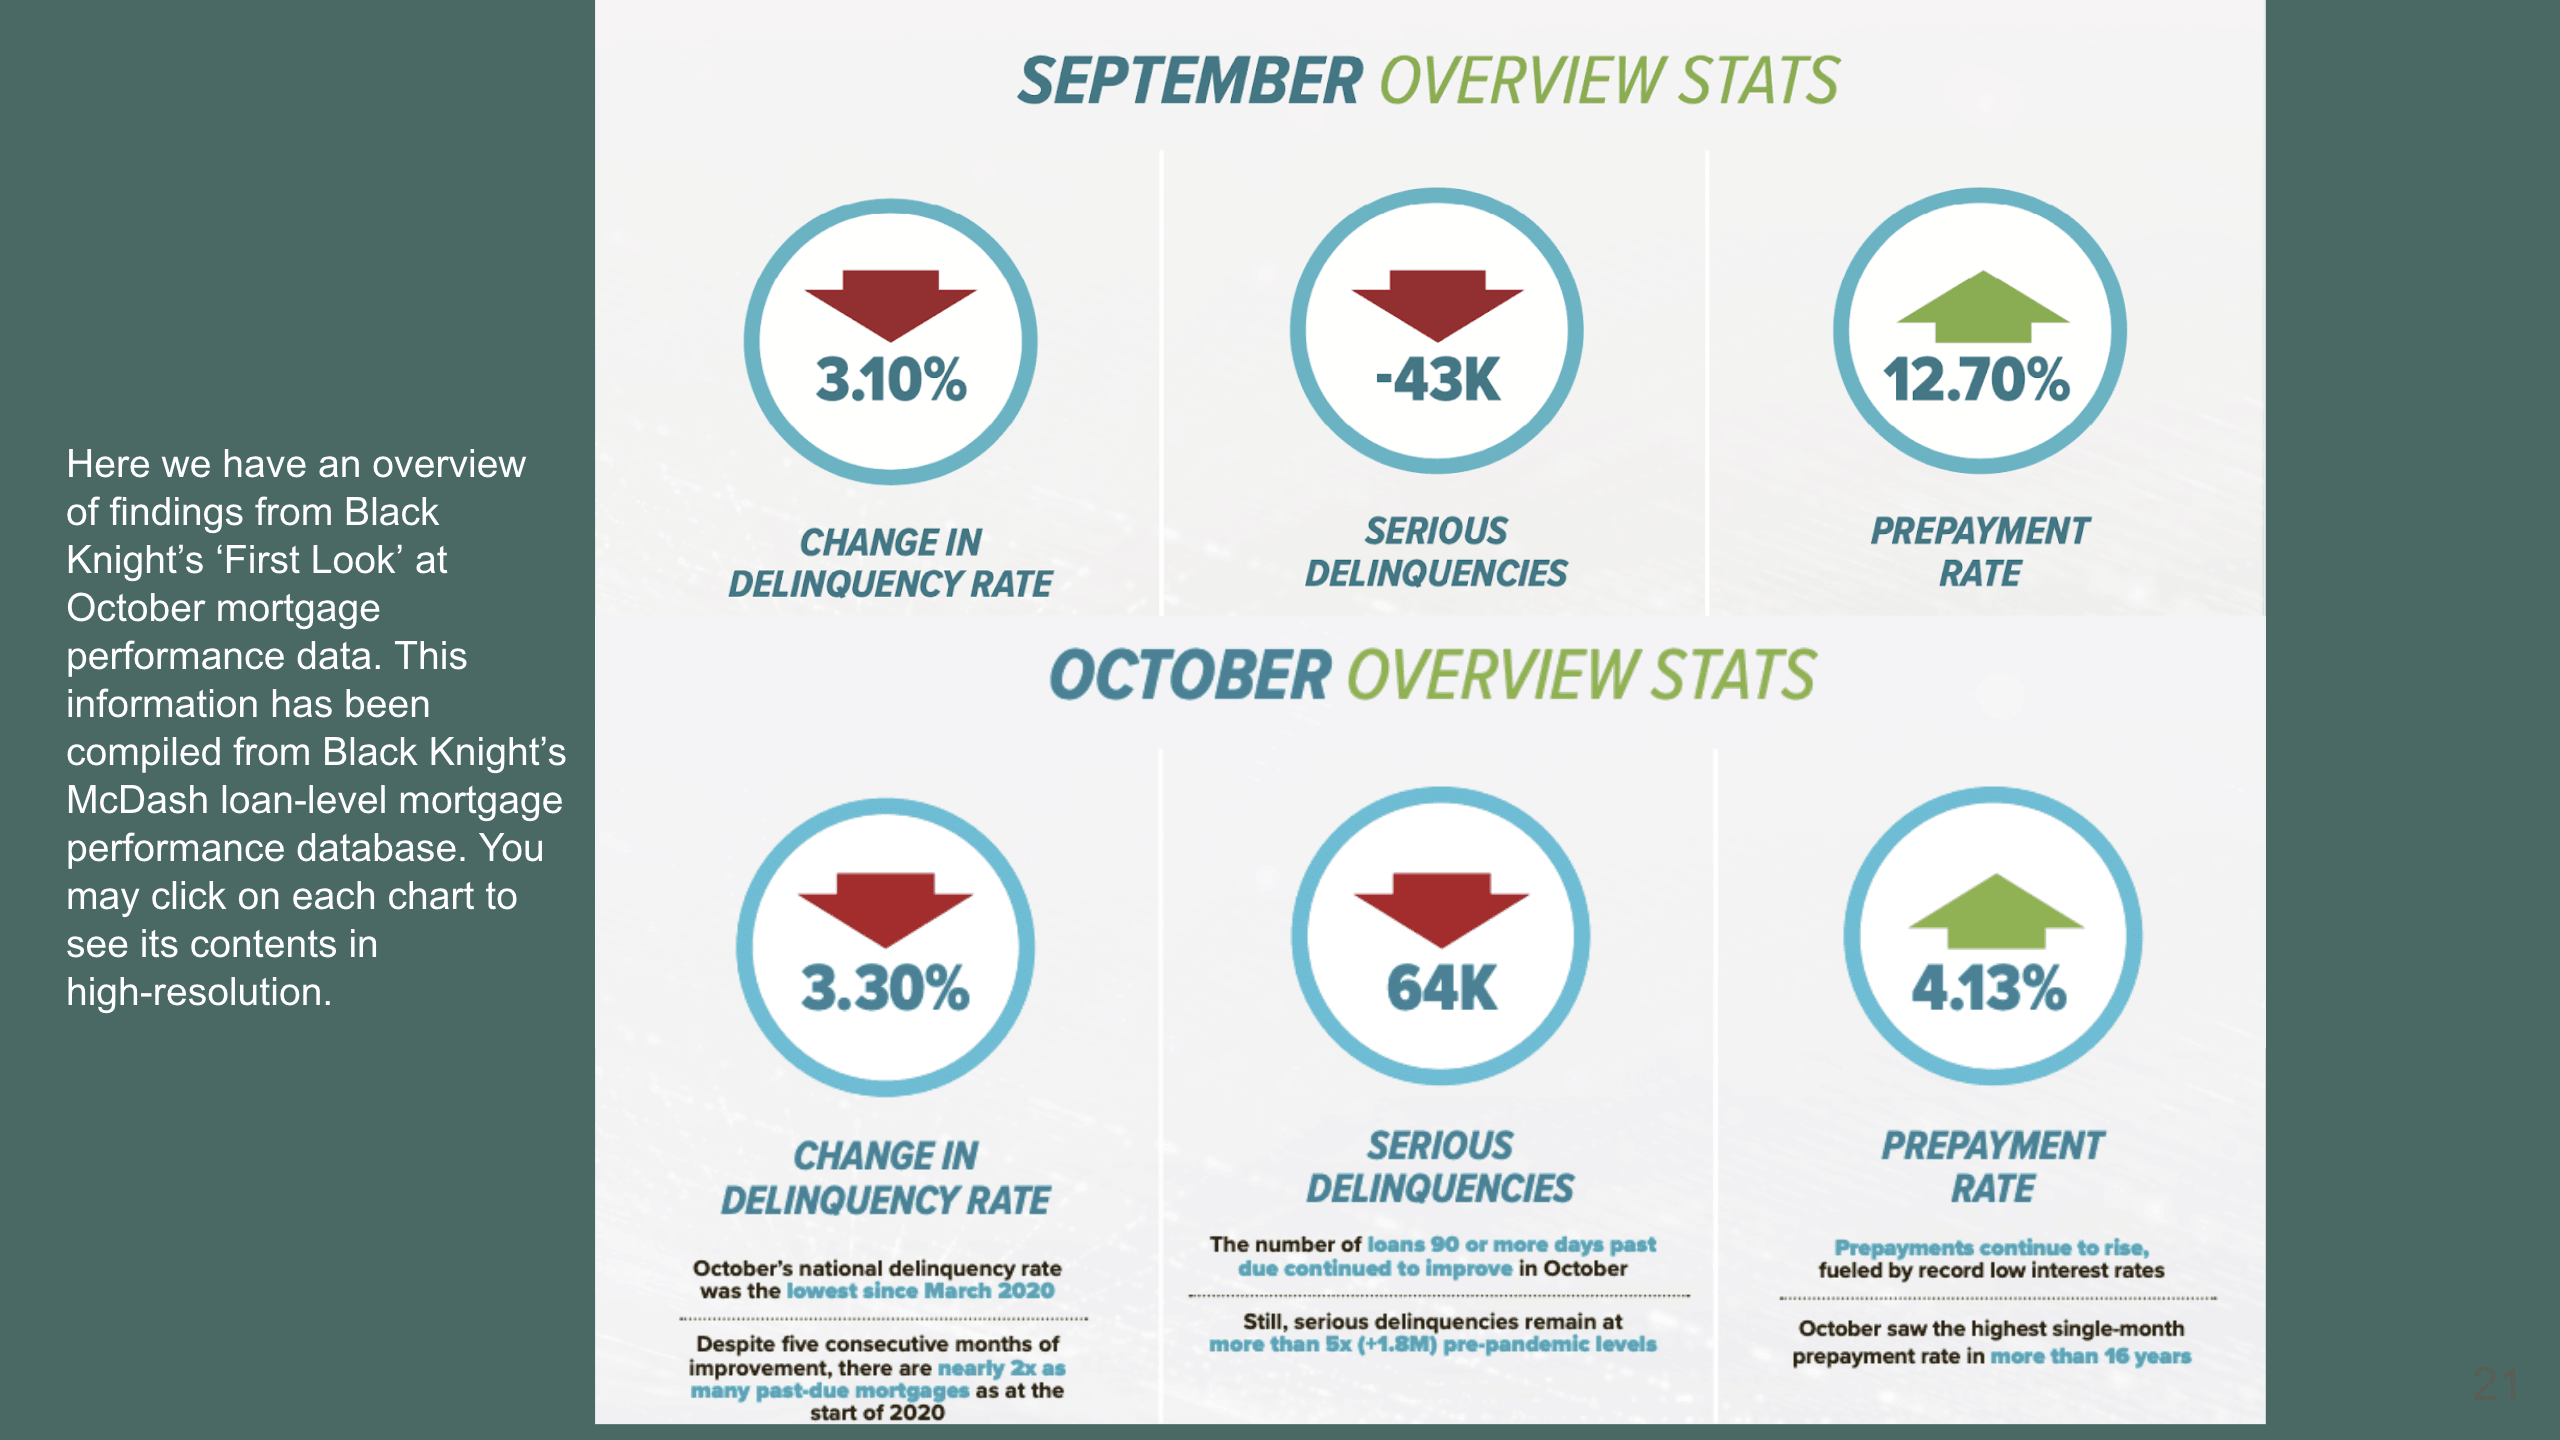
I also want to show you this chart by Black Knight, “First Look” at October mortgage performance data. I shared with you this chart last month with September data, and the bottom one is from October. You see that the change in delinquency rate has continued to go down, and the serious delinquency rate has also gone down by another 64,000 files. The prepayment rate, meaning people are actually coming back to pay their mortgage payments after going into forbearance, went up 12.7% in September, and in October it continued to go up 4.13%. 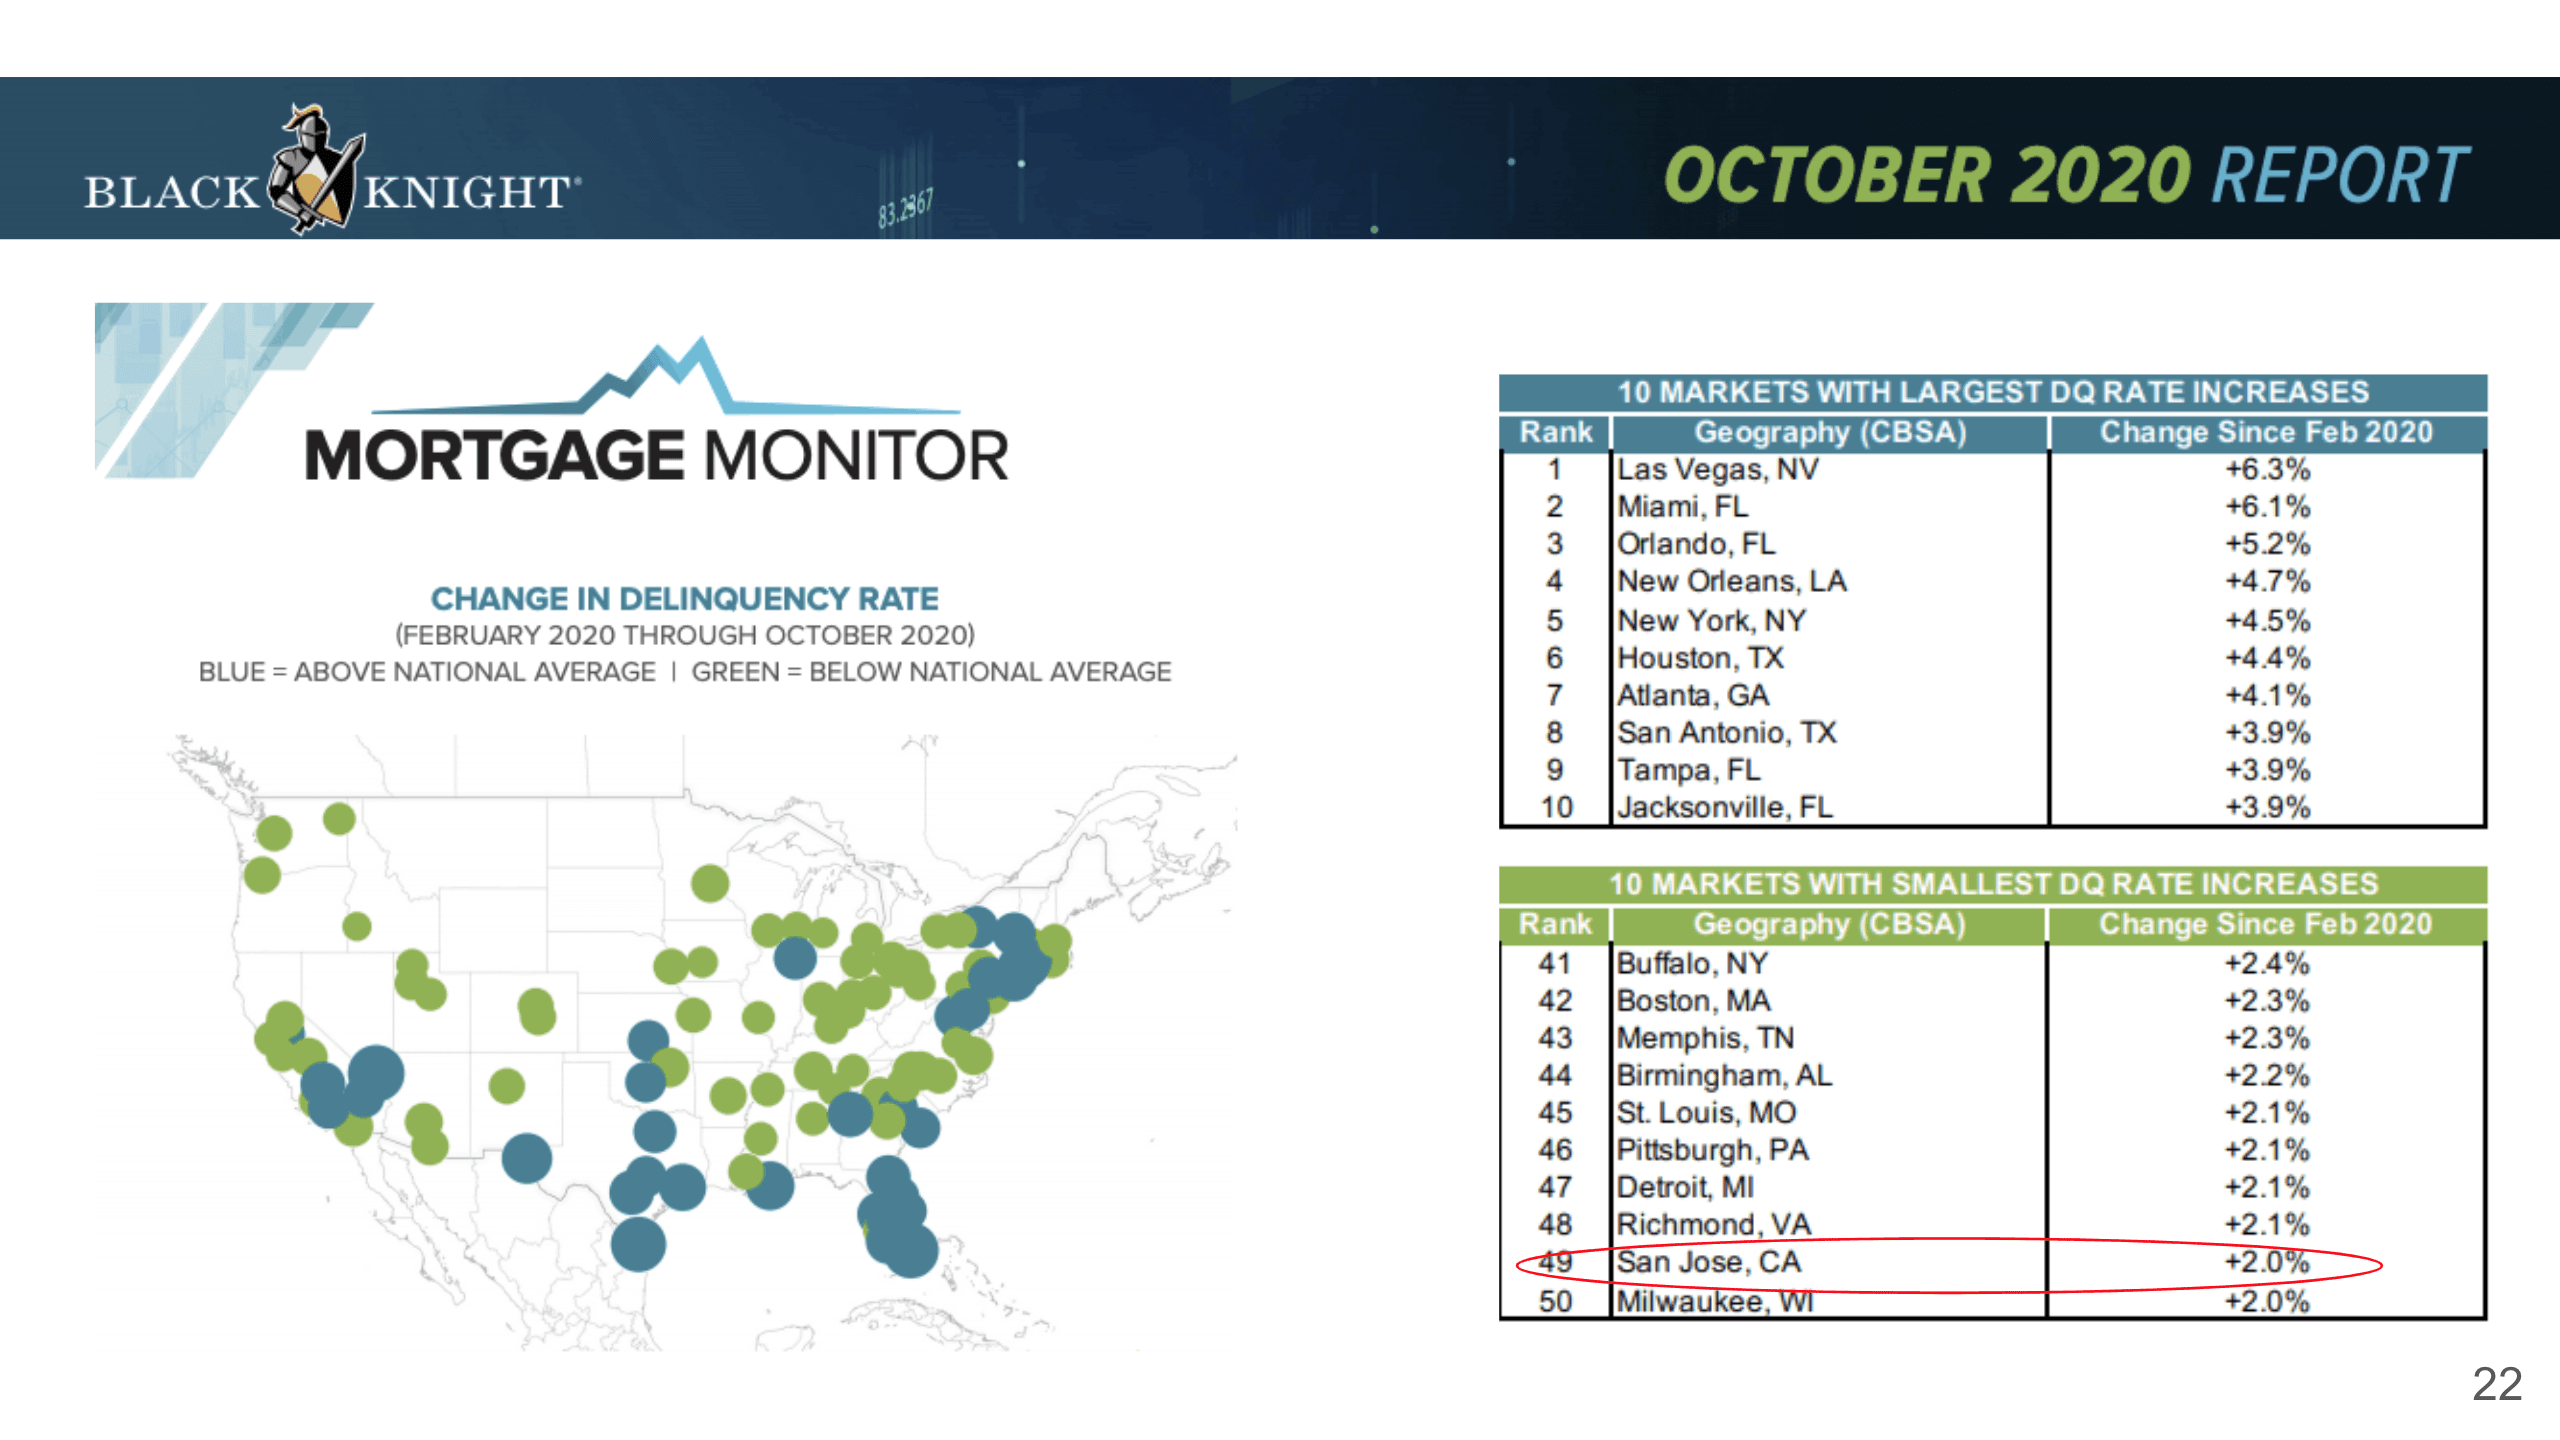
Now on the national level, let’s take a look at which areas have the highest delinquency rate. Of course, we’re most interested in California. These green dots mean that they are below the national average, and so if you look at the 10 markets with the largest delinquency rate, they are Las Vegas, Miami, many places in Florida here, Texas, Louisiana, New York, etc. And look at that, San Jose is ranked 49 out of 50, and is one of the 10 markets with the lowest delinquency rate, so we are really not doing that bad at all.
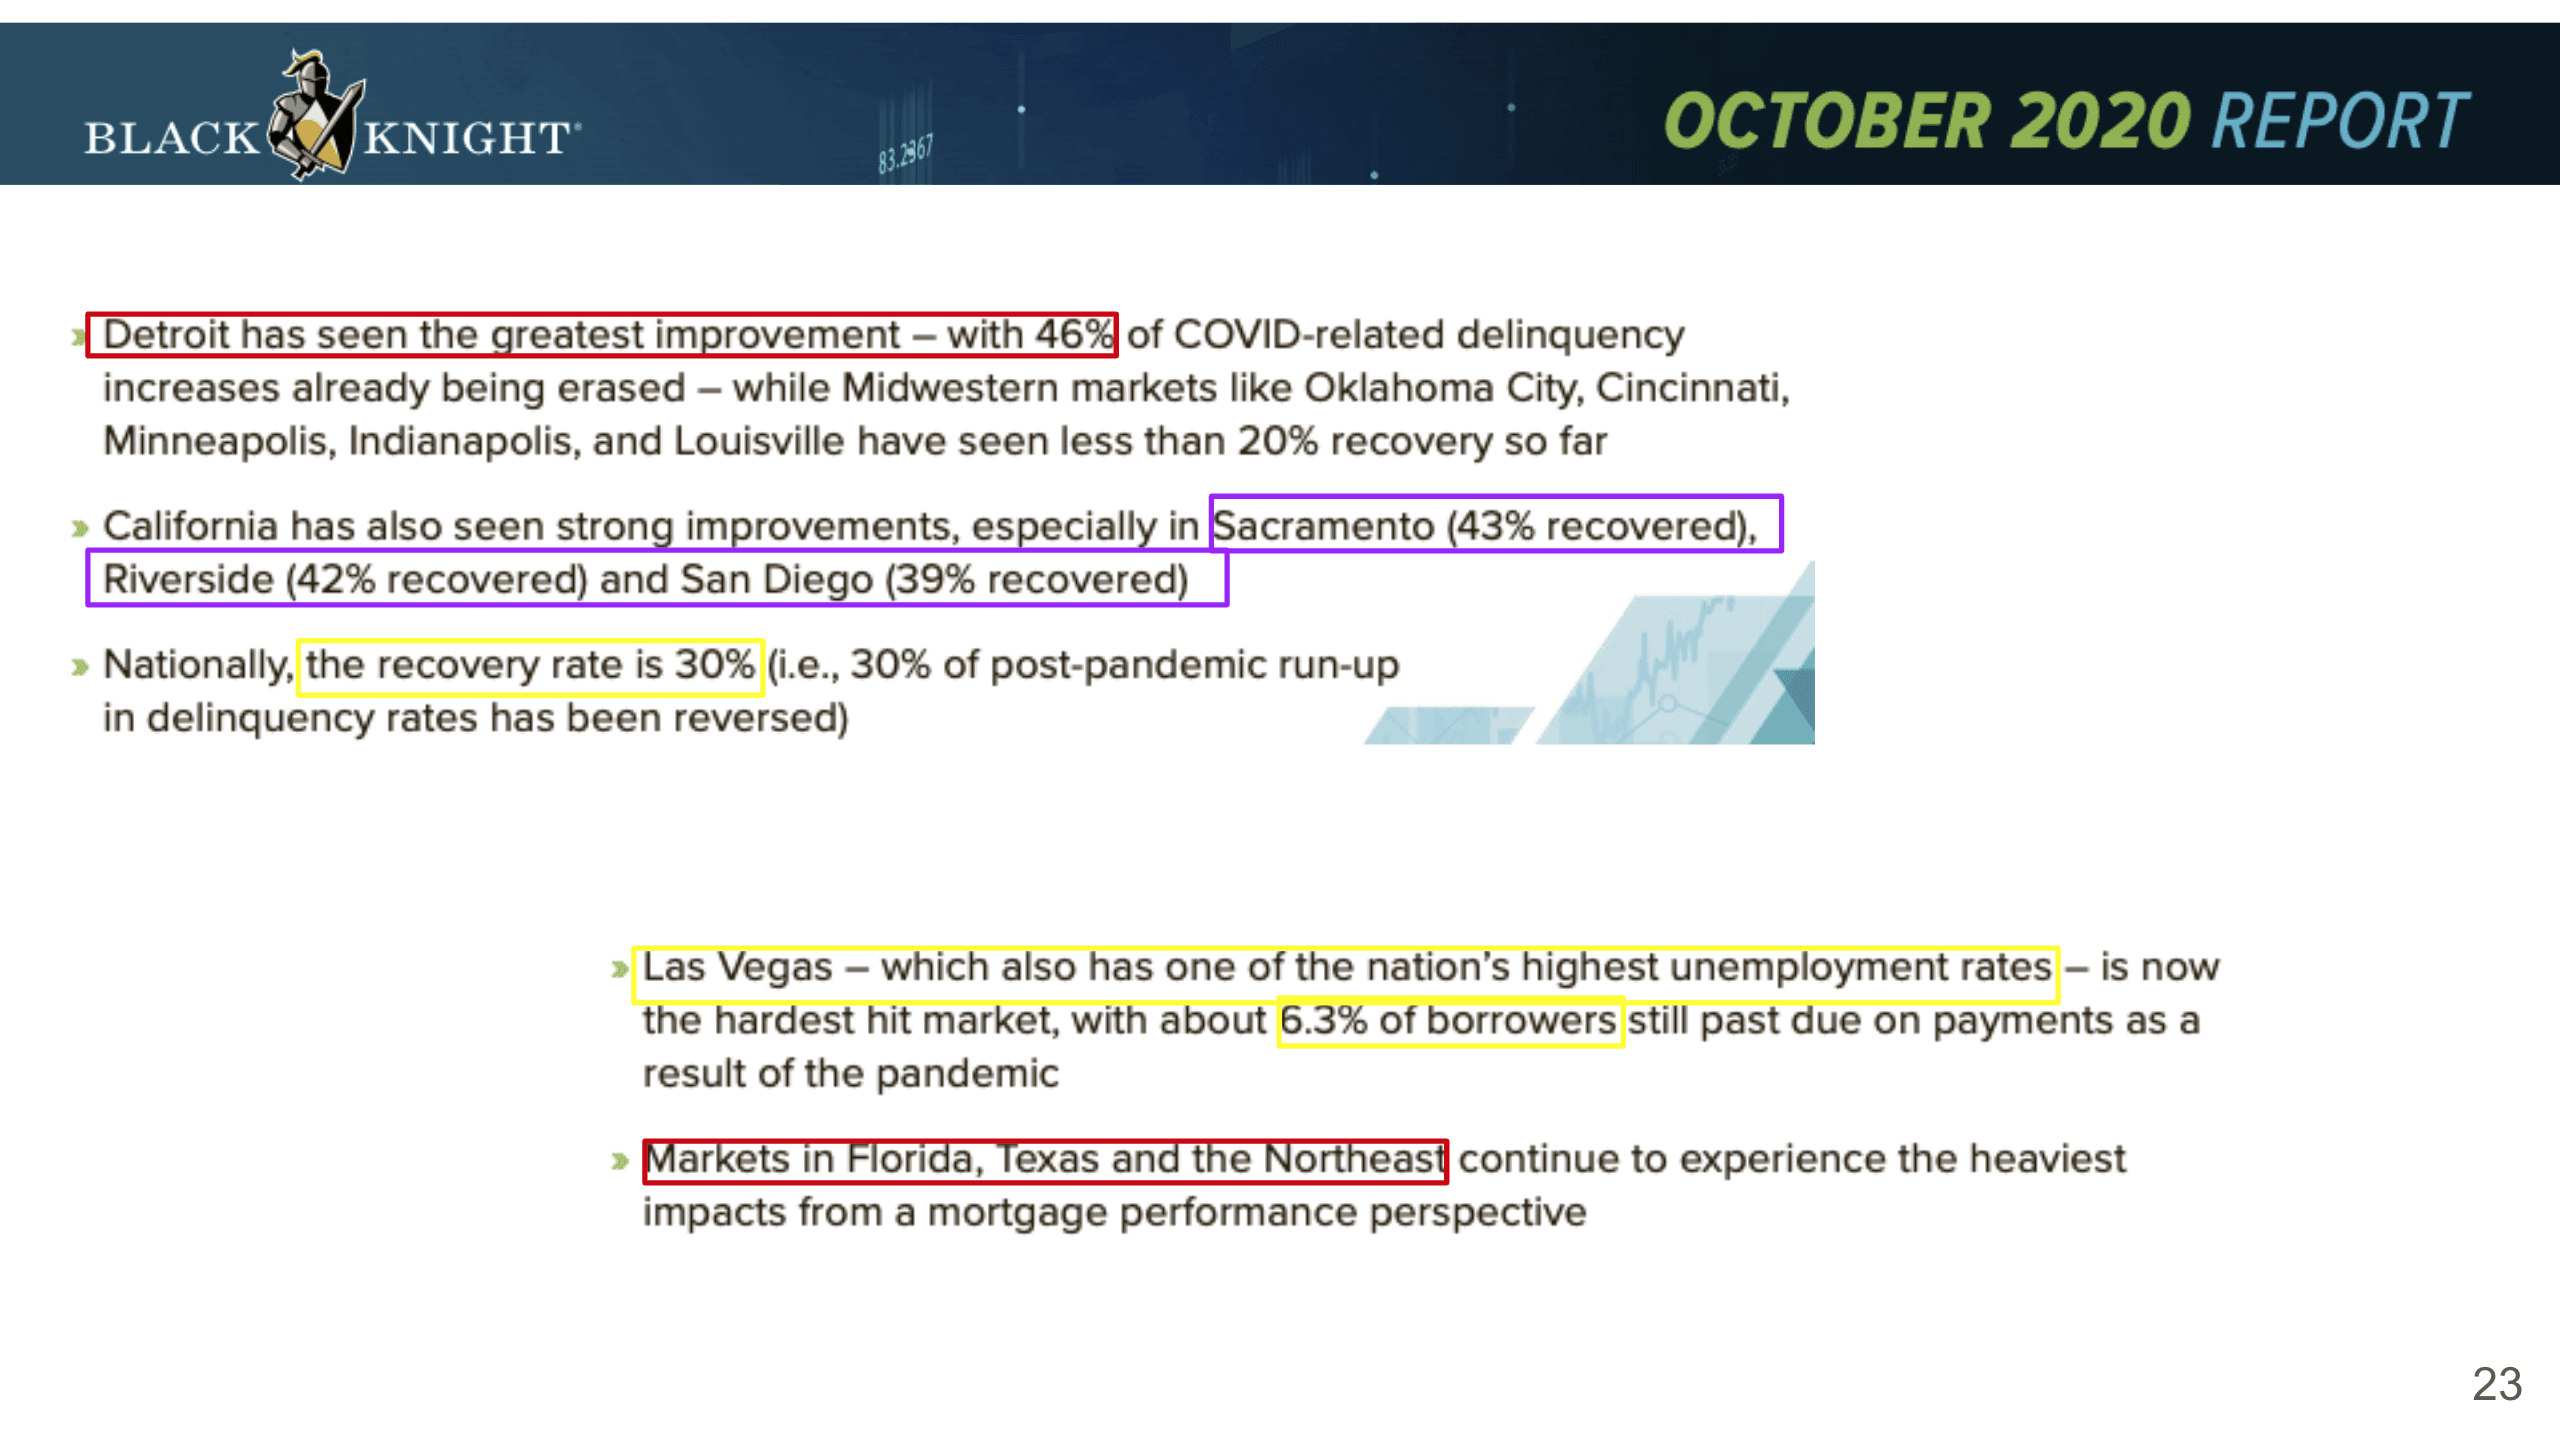
Here we see that “Detroit has seen the greatest improvement – with 46% of COVID-related delinquency increases already being erased”. California wise, we actually see Sacramento, Riverside, and San Diego have the strongest improvement. The national recovery rate is actually about 30%, while Las Vegas again is getting hit the hardest and has one of the nation’s highest unemployment rates. There are about 6.3% of borrowers still past due on the payment. Markets in Florida, Texas, and the Northeast continue to experience the heaviest impacts from a mortgage performance perspective.
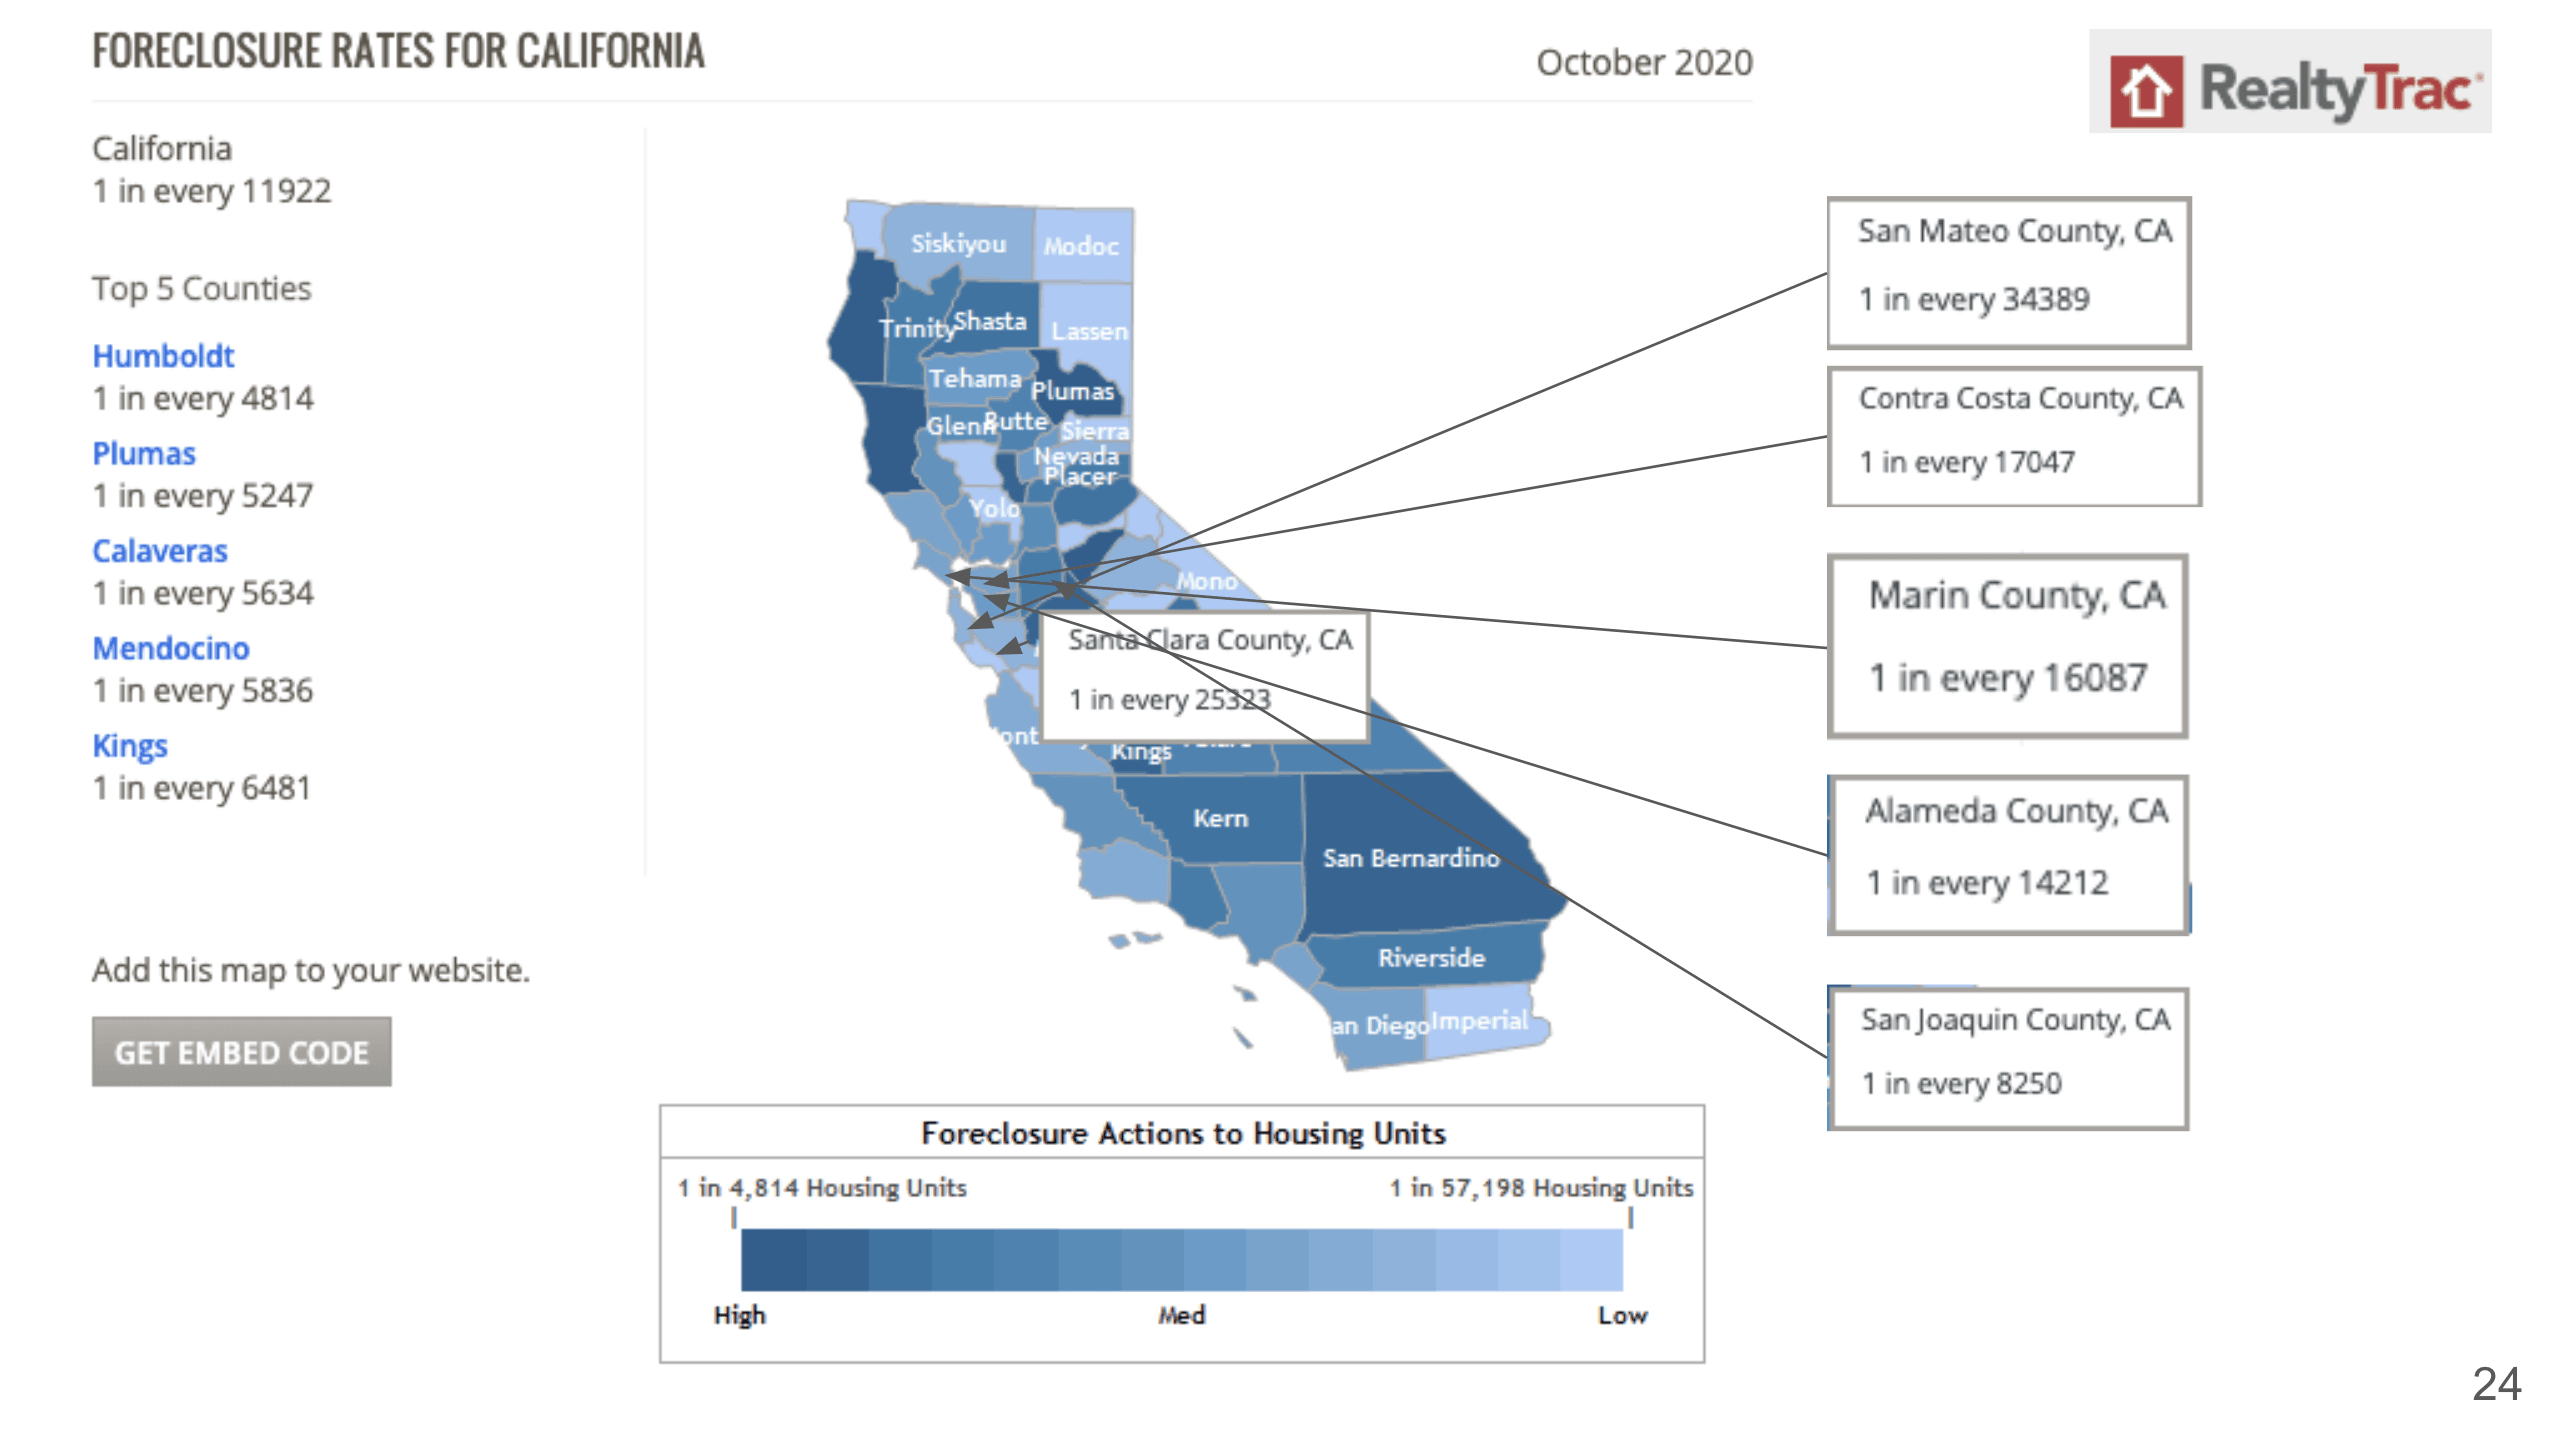
What about these foreclosures? Just remember forbearance does not equal foreclosure. During forbearance, you’re still negotiating with the bank, and the bank has not foreclosed on you yet. I want to show you some of the numbers on foreclosure and the top five counties in California with the highest foreclosure rates right now. They are Humboldt, Plumas, Calaveras, Mendocino, and Kings. In comparison, in Santa Clara County we only have one foreclosure in every 25,000 homes, San Mateo County has one in every 34,000 homes, Contra Costa has one in every 17,000 homes, Marin County has one in every 16,000 homes, Alameda has one in every 14,000 homes, and San Joaquin is a bit higher with one in every 8250 housing units. As you can see that our numbers here are not that bad at all.
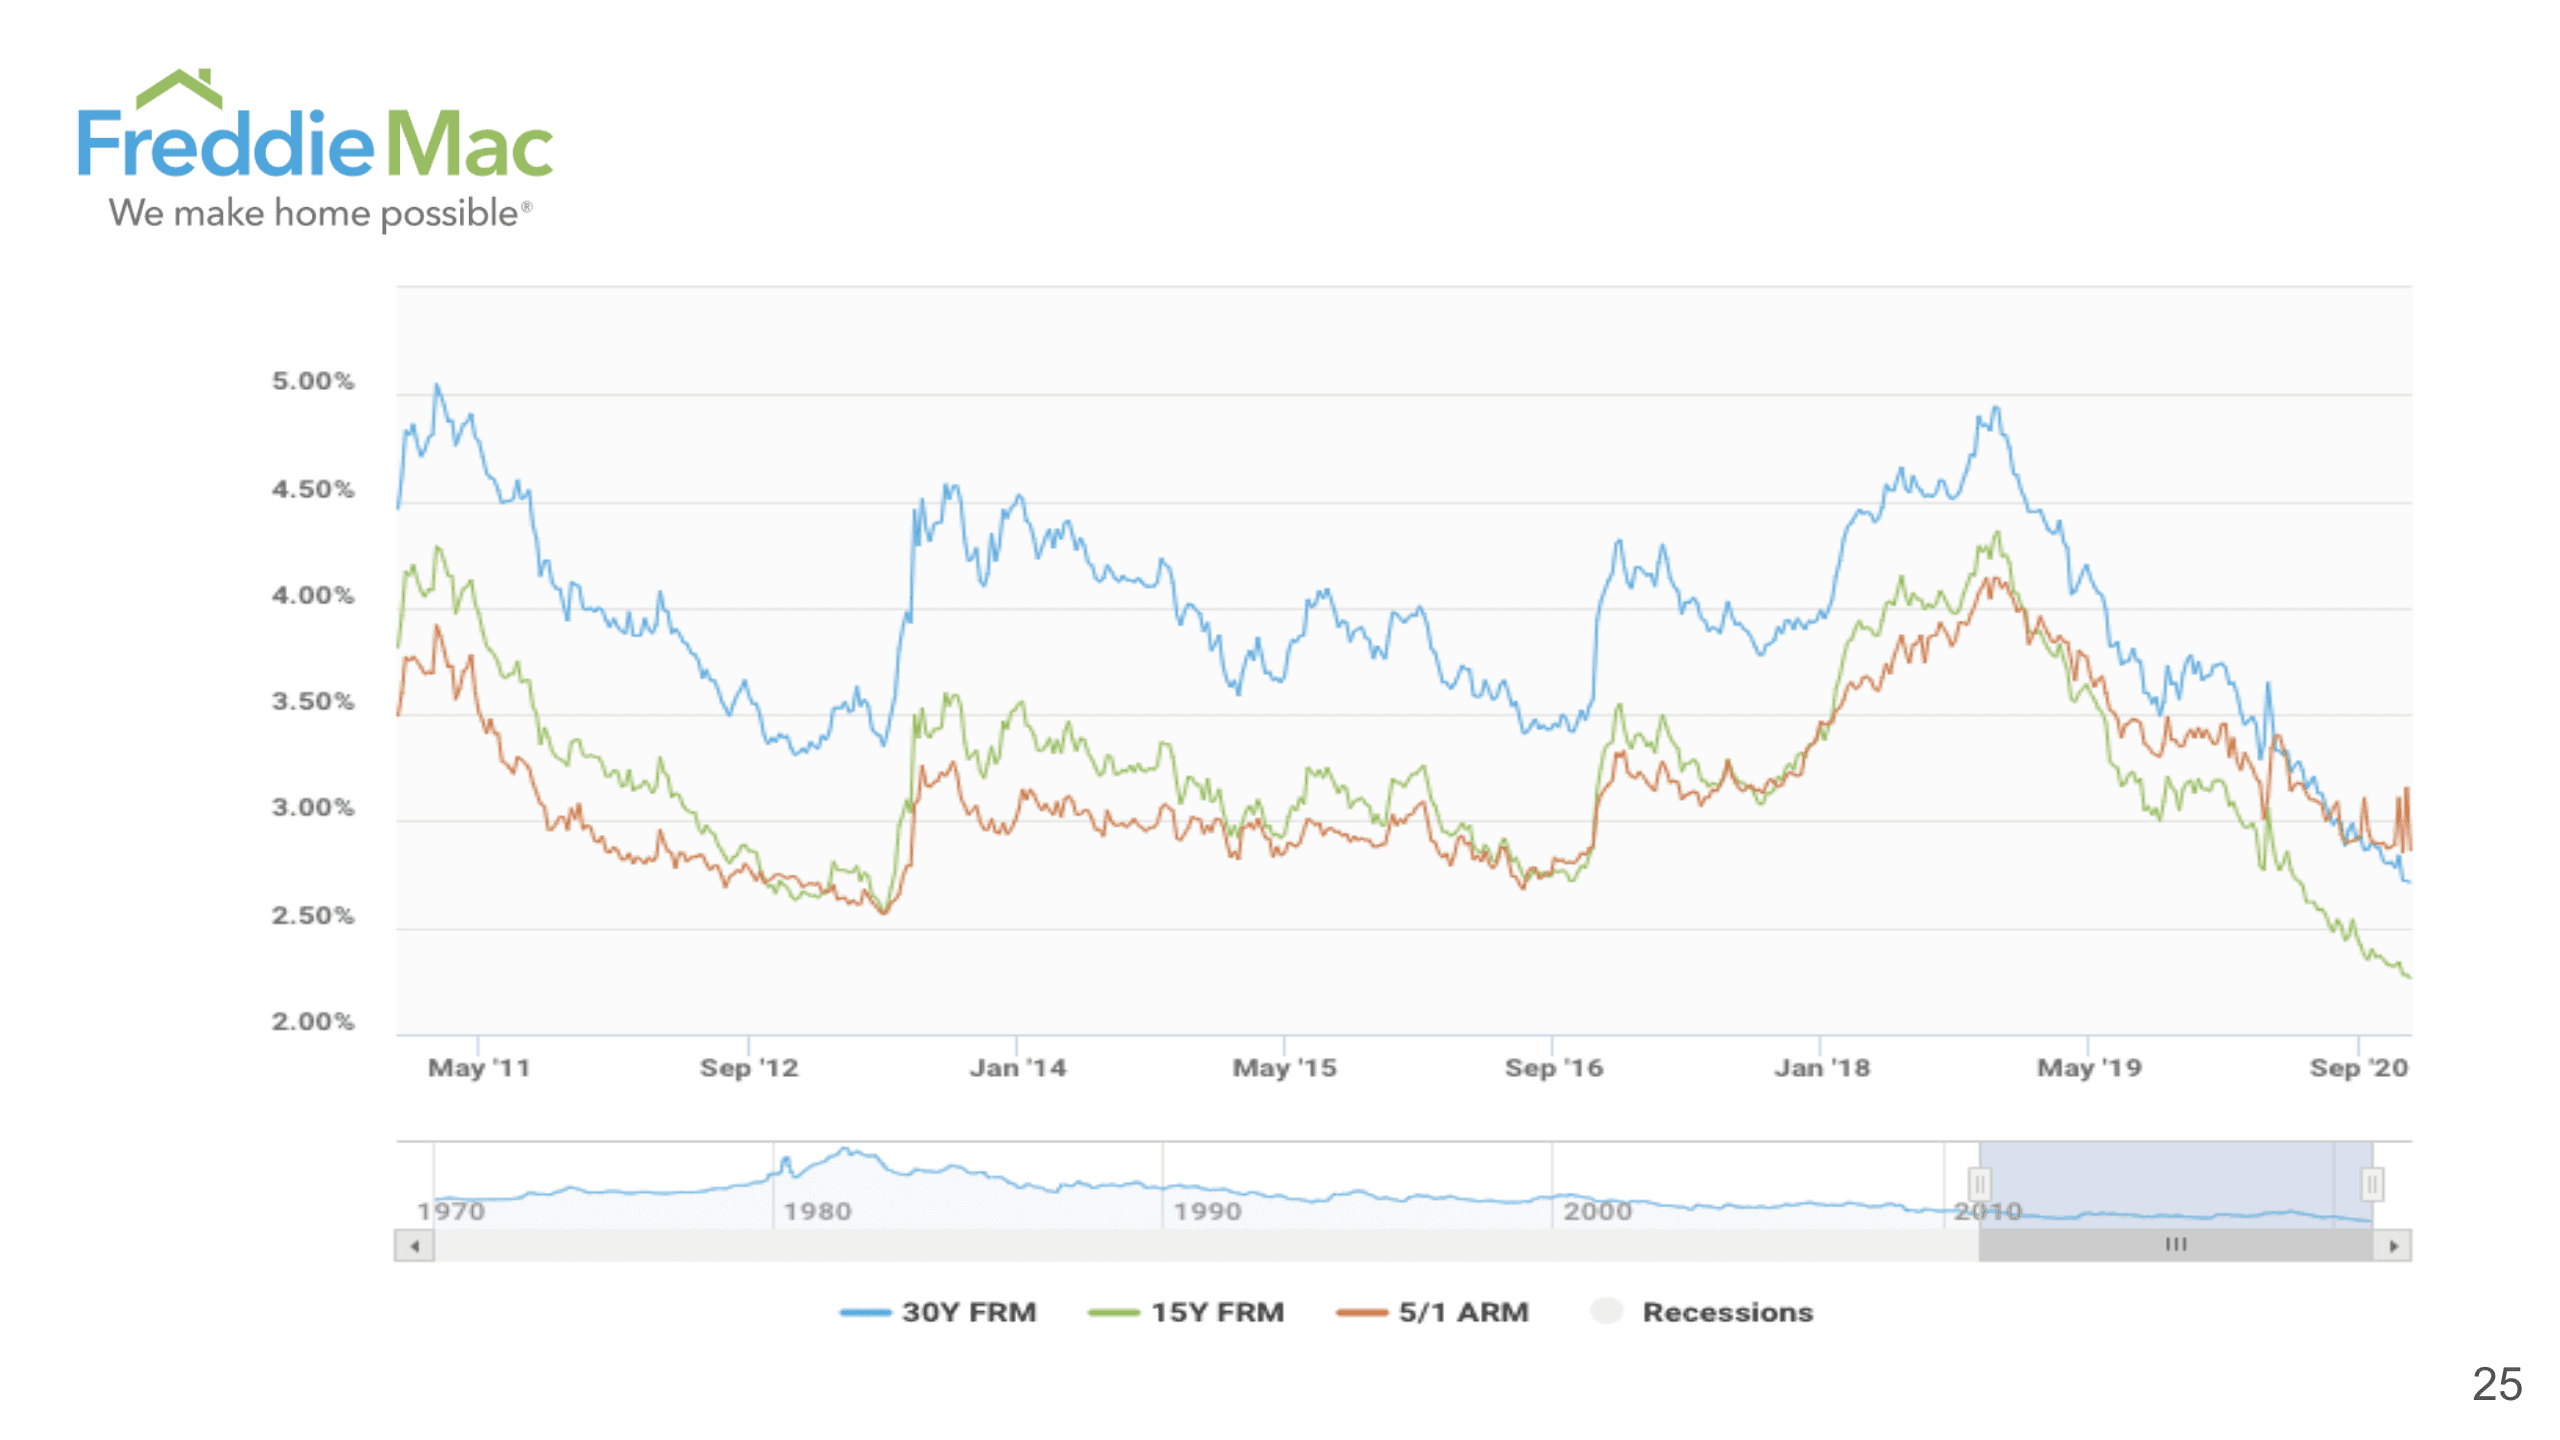
This chart, again, shows us visually that the interest rate is at a historical low right now. For 30 years we are absolutely at a historical low since 2011, but even before that, 2007, 2008, it was 6% to 7% for 30 years at the time.
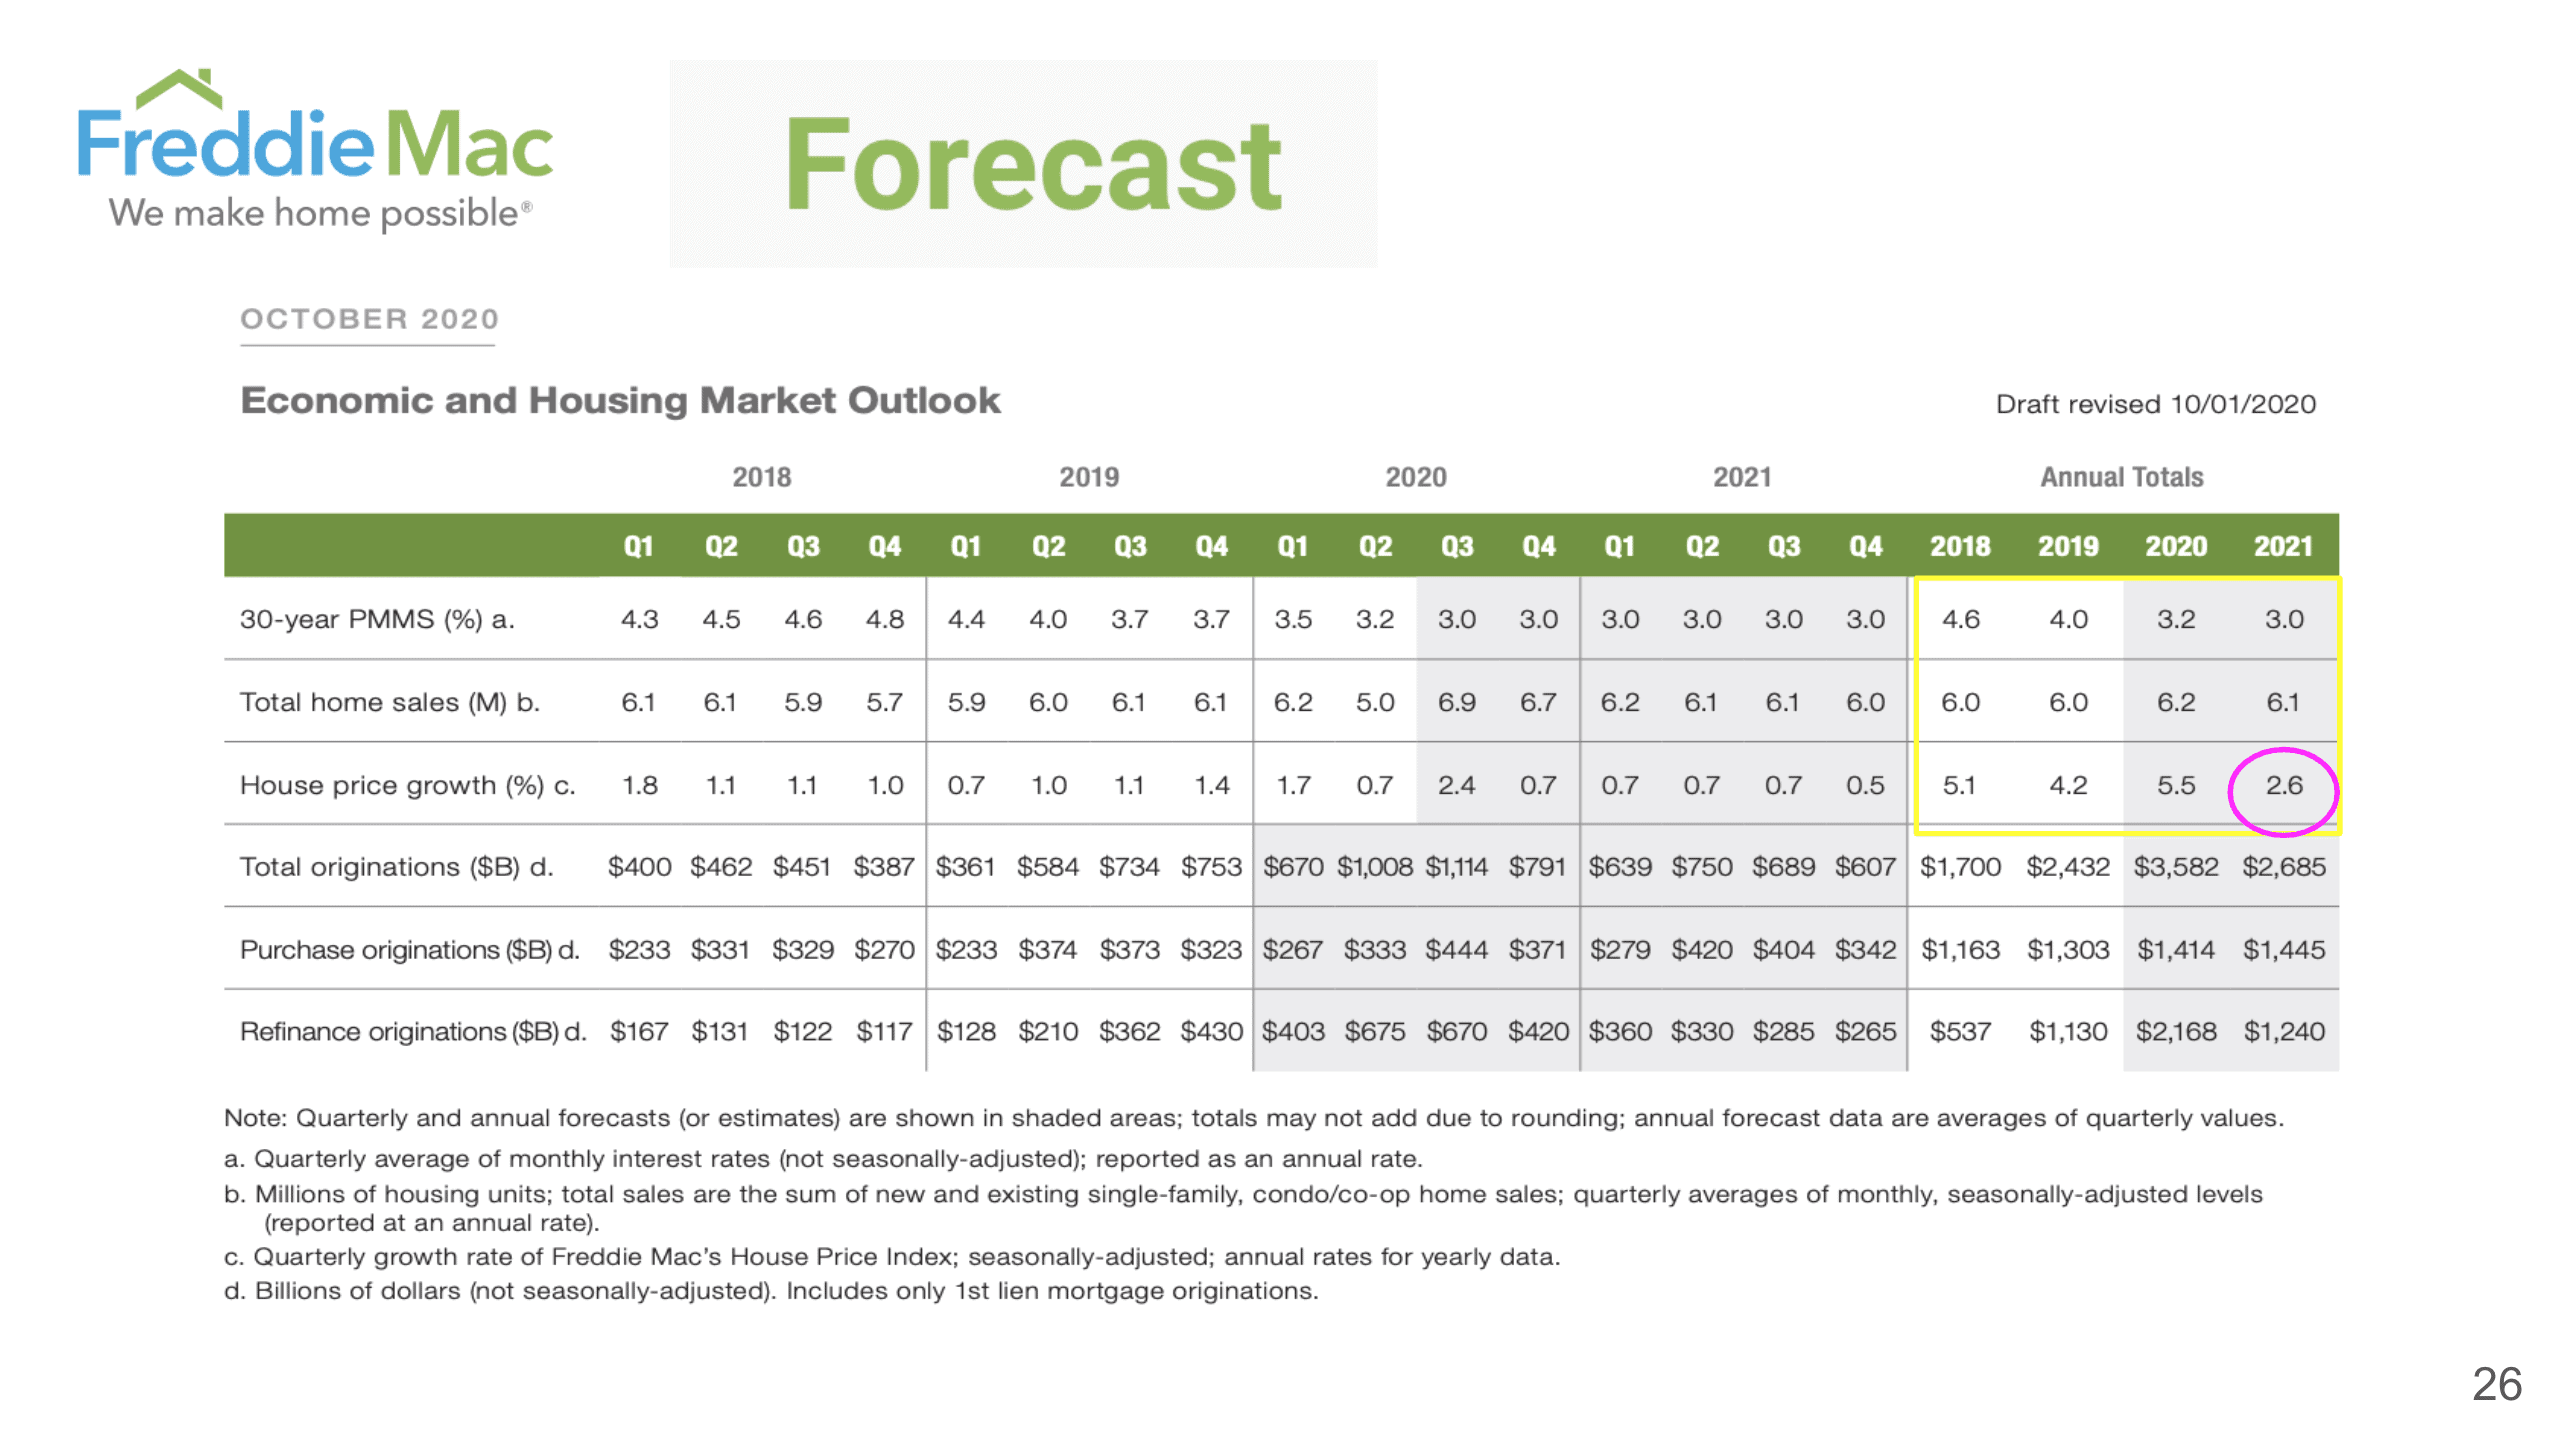
Forecast from Freddie Mac predicts the interest rate continues to stay around 3% for 2021, home sales are going to stay pretty strong, and the growth percentage is about 2.6% in 2021.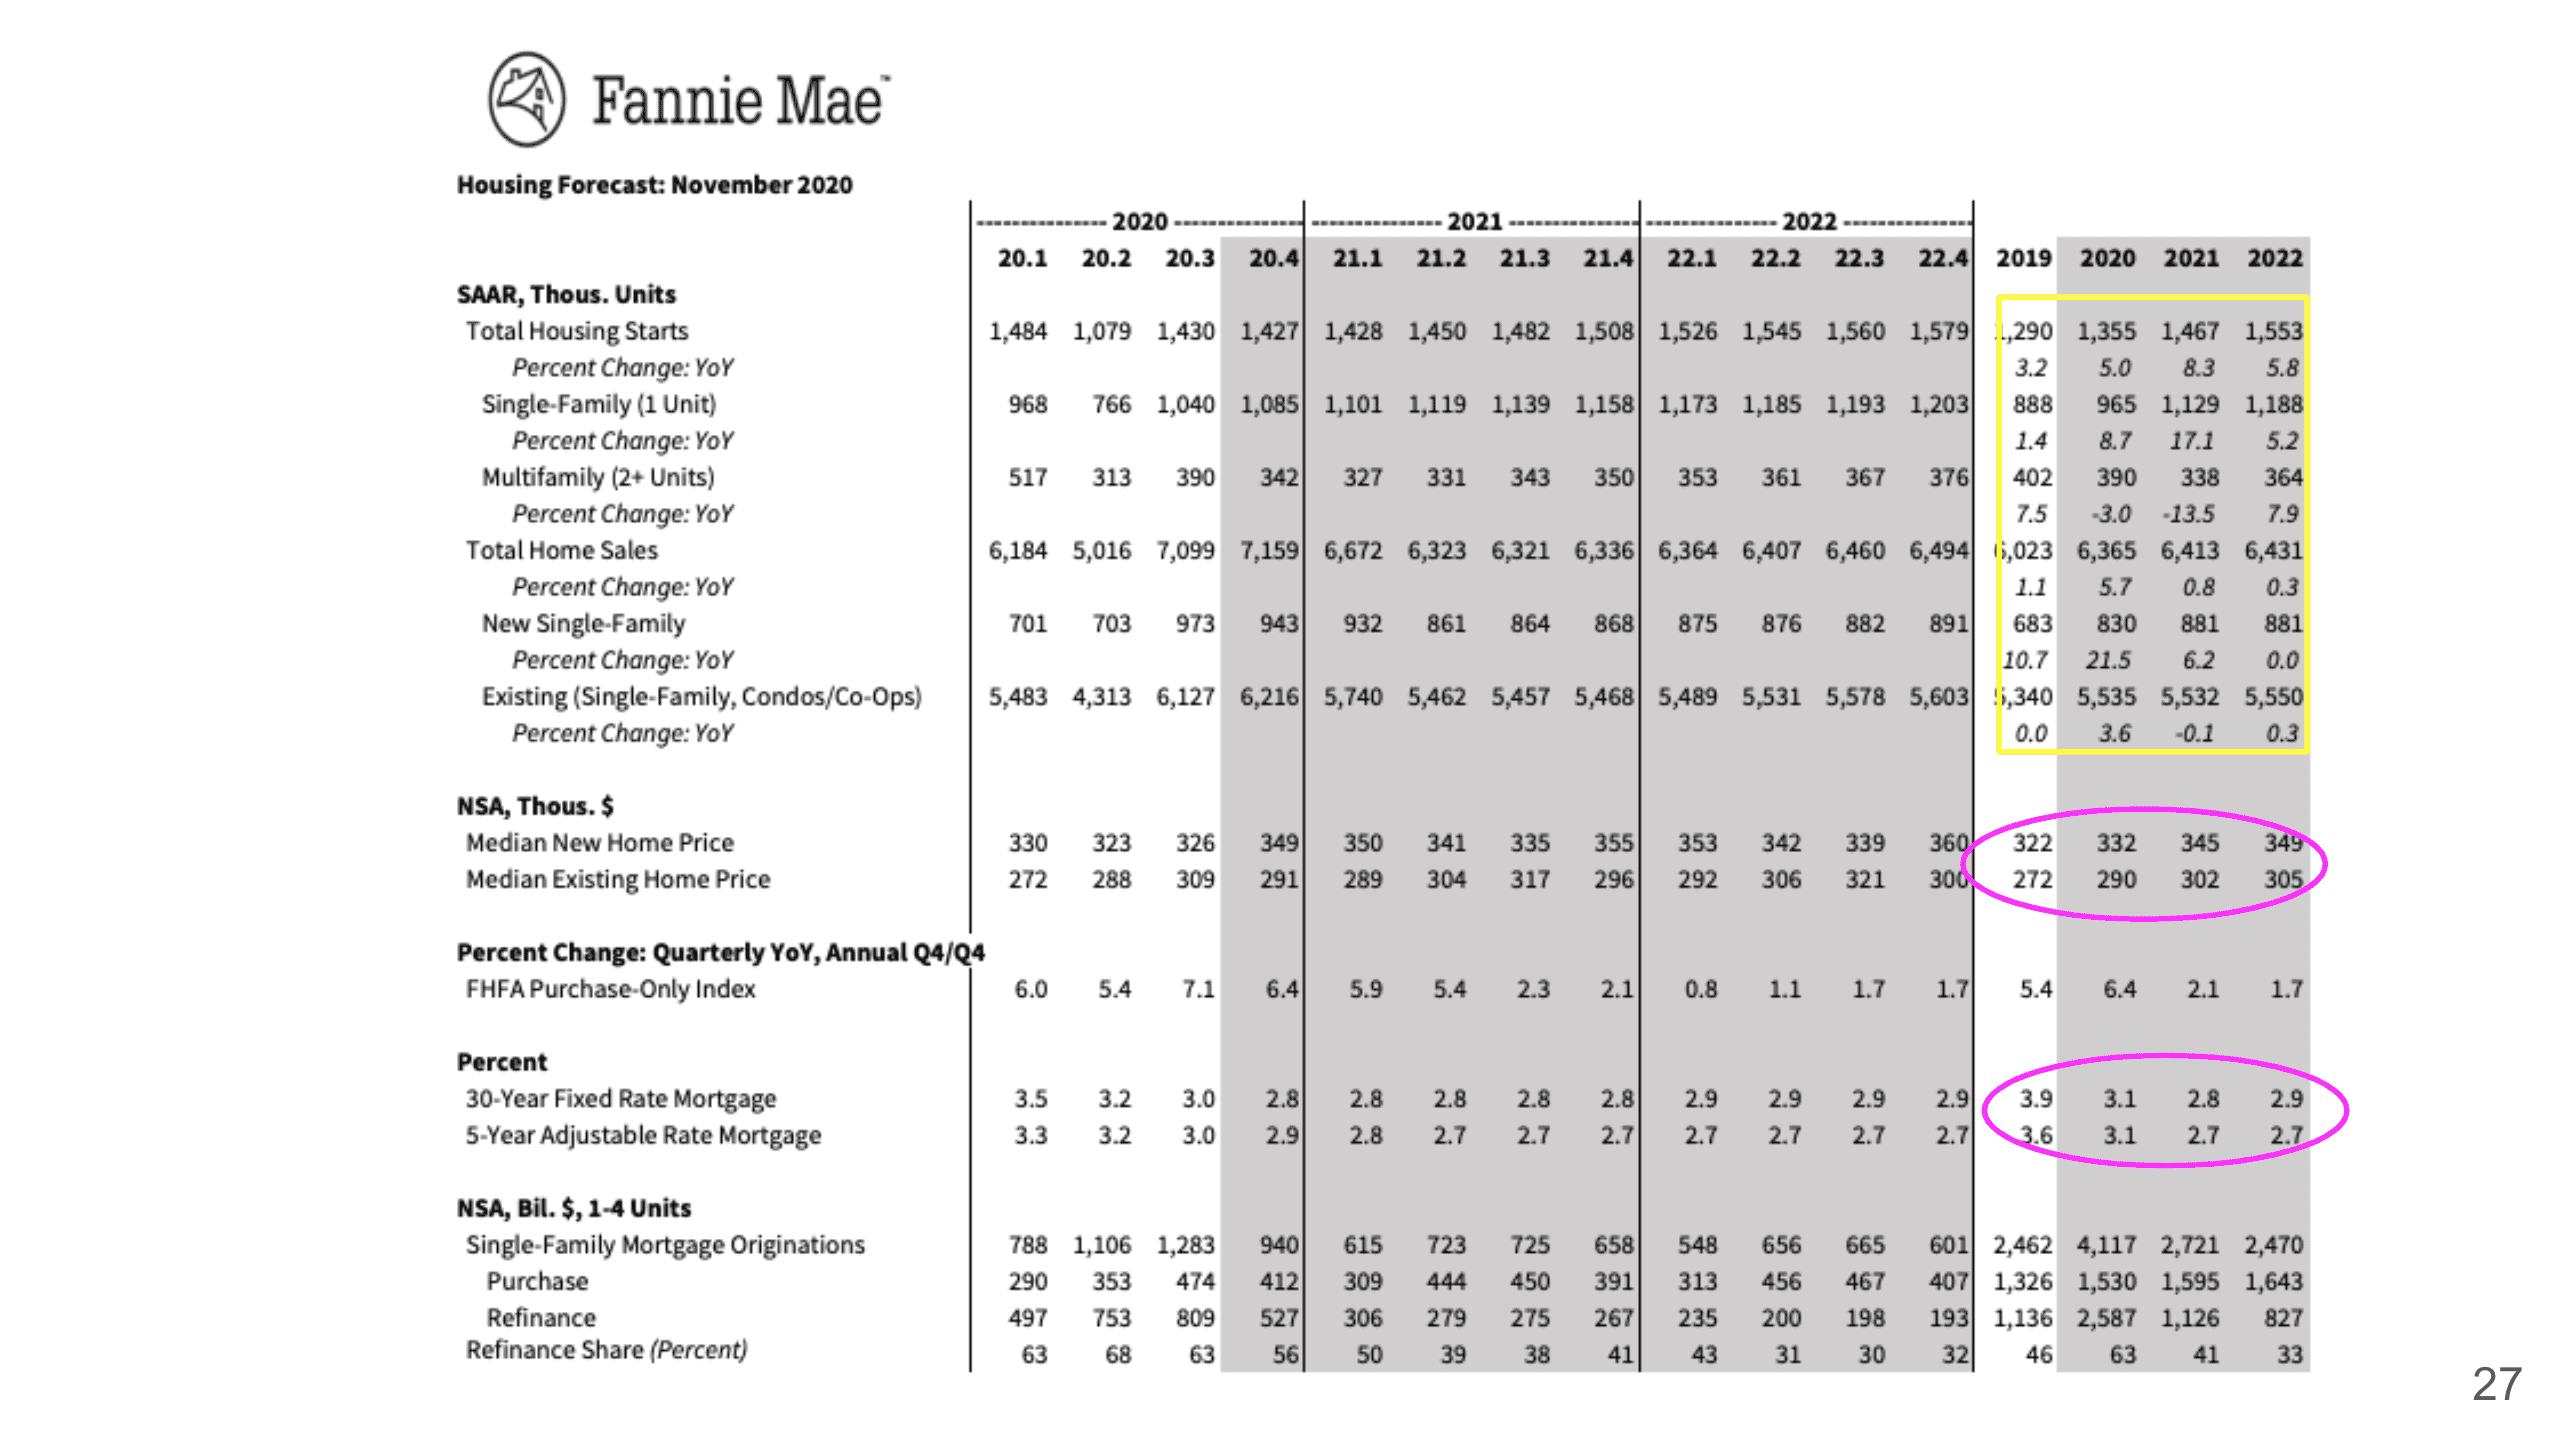
So here is data from Fannie Mae, their prediction is that the 30 years fixed rate here until 2022 is actually 2.9% and the 5-year adjustable rate is 2.7%. I’m just thinking if it’s only a 20 basis point difference, why wouldn’t you go to 30 years instead of 5 years. Again, their median home price is still continuing to go up in their forecast. Also, in terms of the housing units, we have very moderate growth.
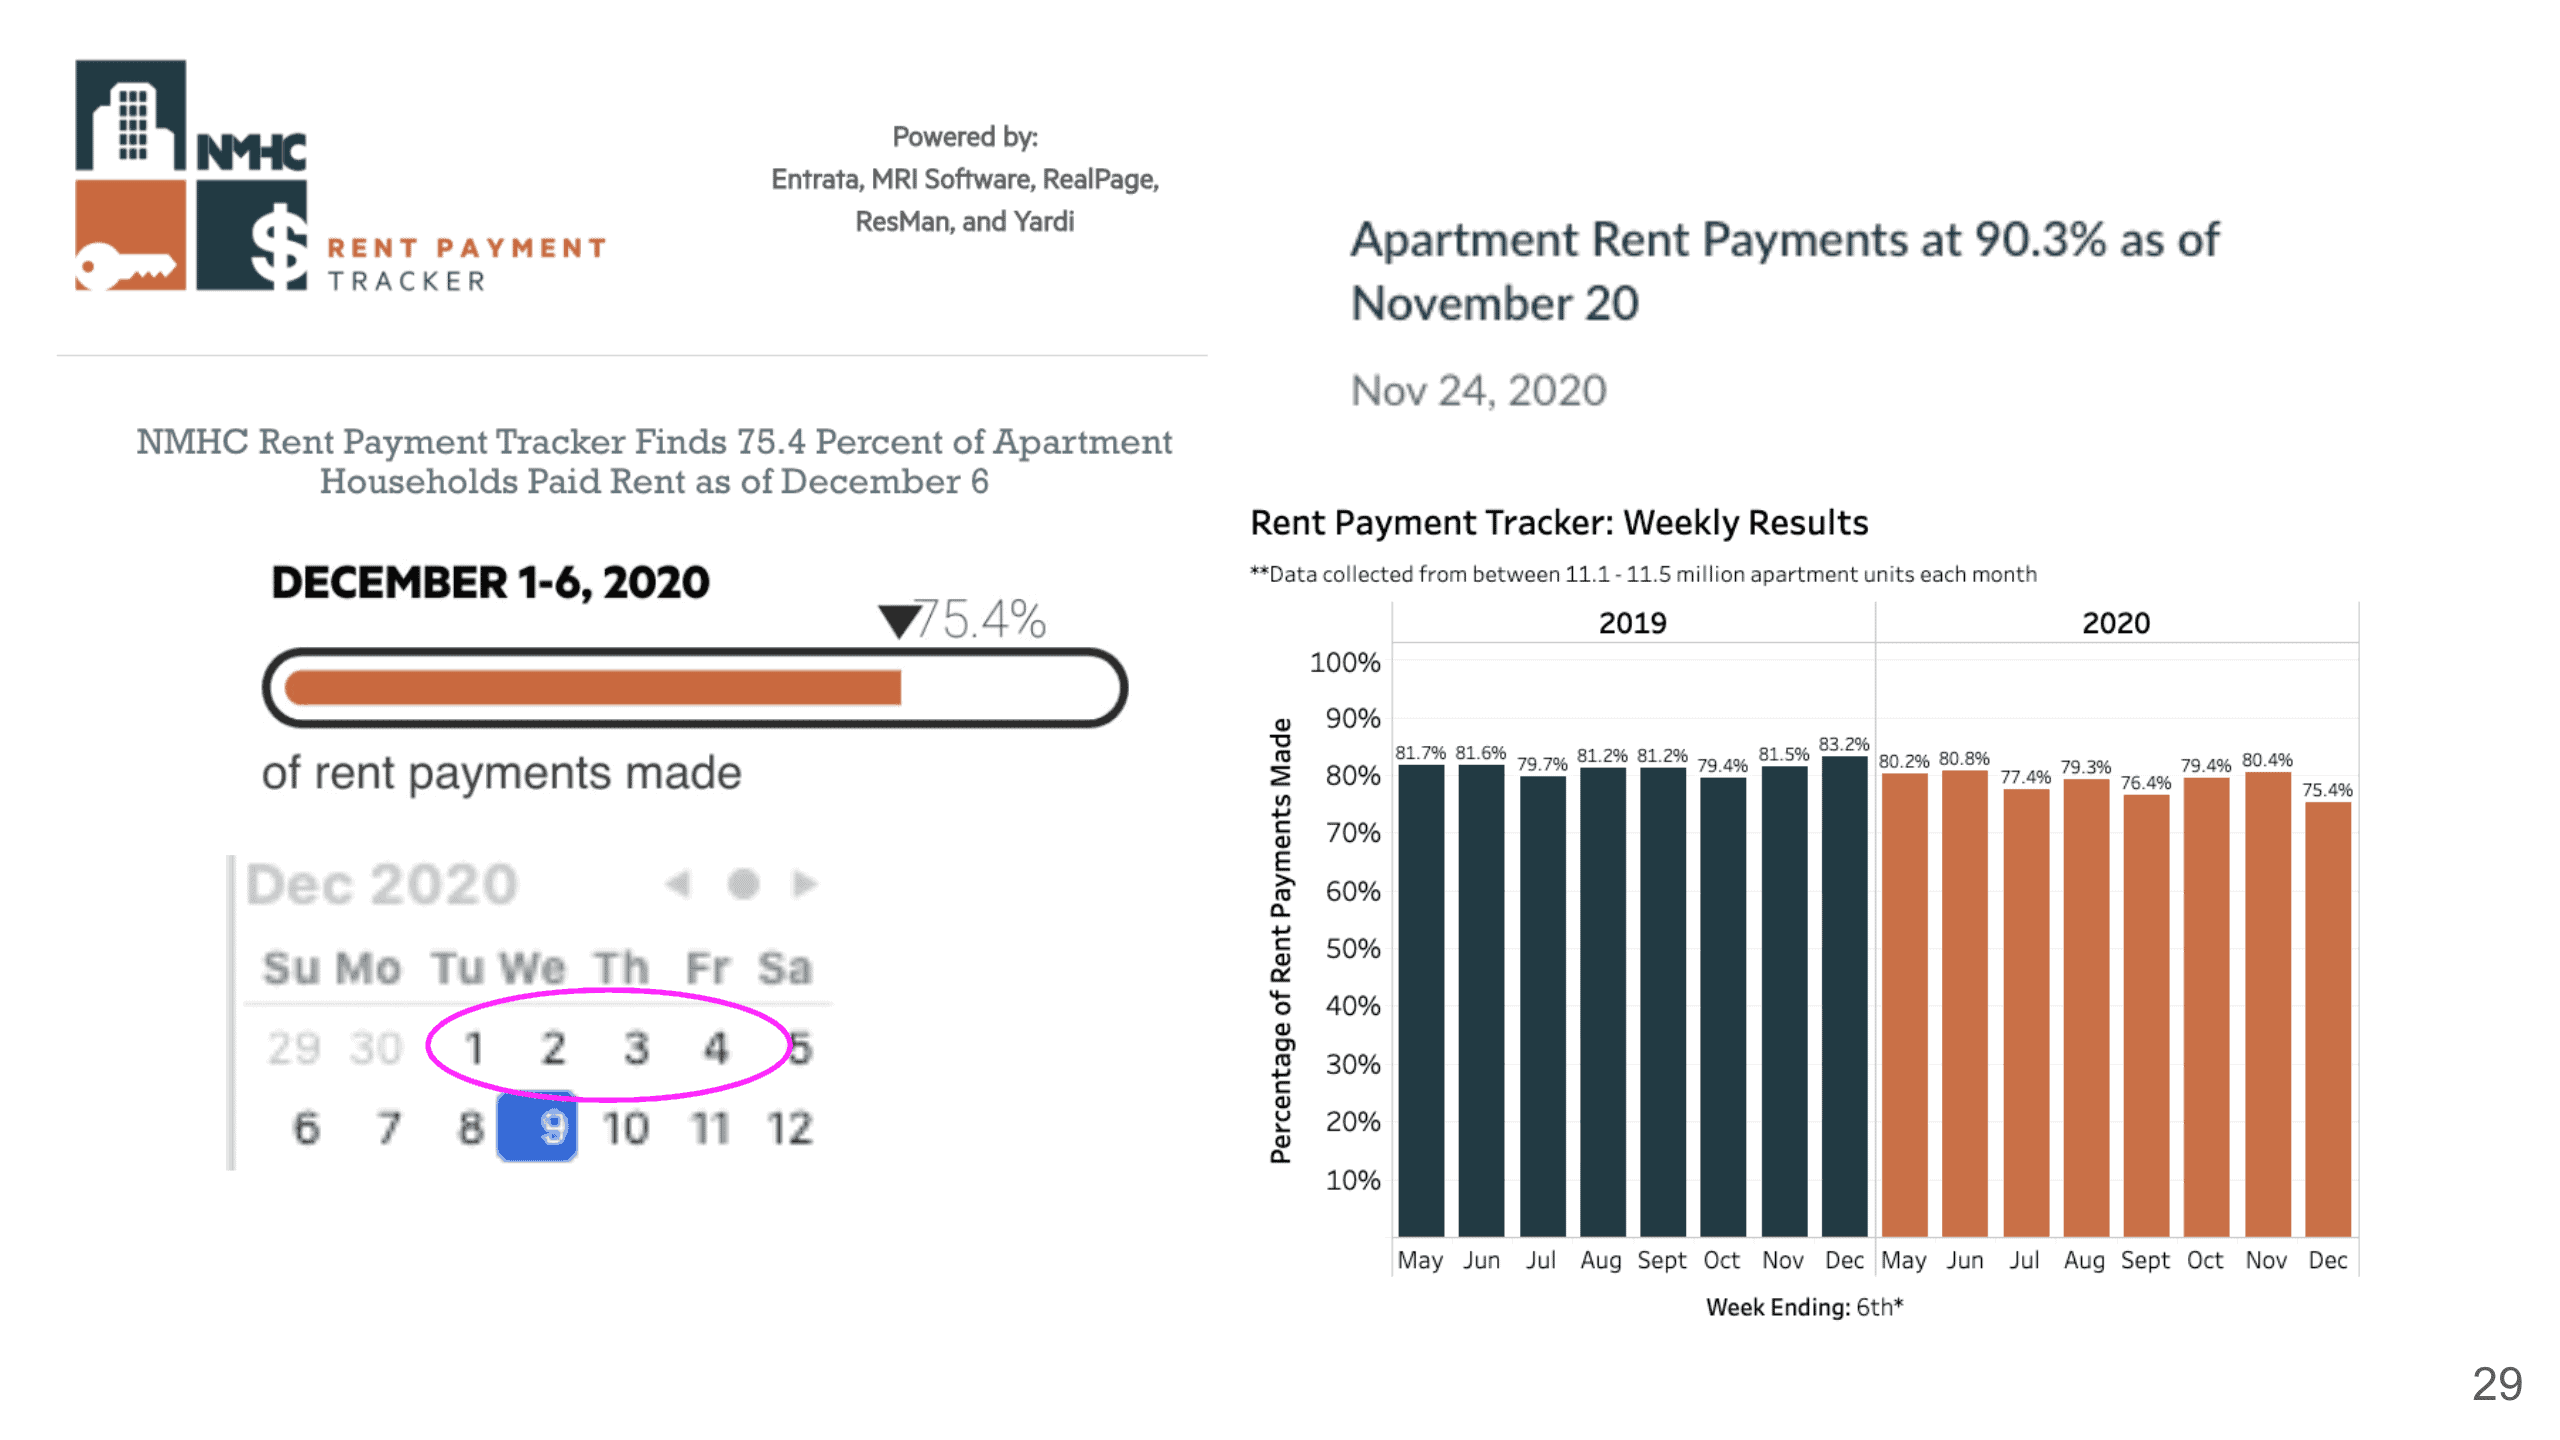
What about multi-family? In December, we actually have 75.4% of the rent payments that are being made on time, and it is actually lower than last month. As you see that 75.4% is lower than the pre-COVID time. However, what I realized is that because it’s tracking from December 1st to December 6th, so that’s Tuesday through Friday, then a weekend, so that’s why it’s definitely lower. If they have included a few more days here probably we can see a little bit higher number. But at the end of November when they looked at the rent payment at the time, it was actually 90.3% as of November 20th.
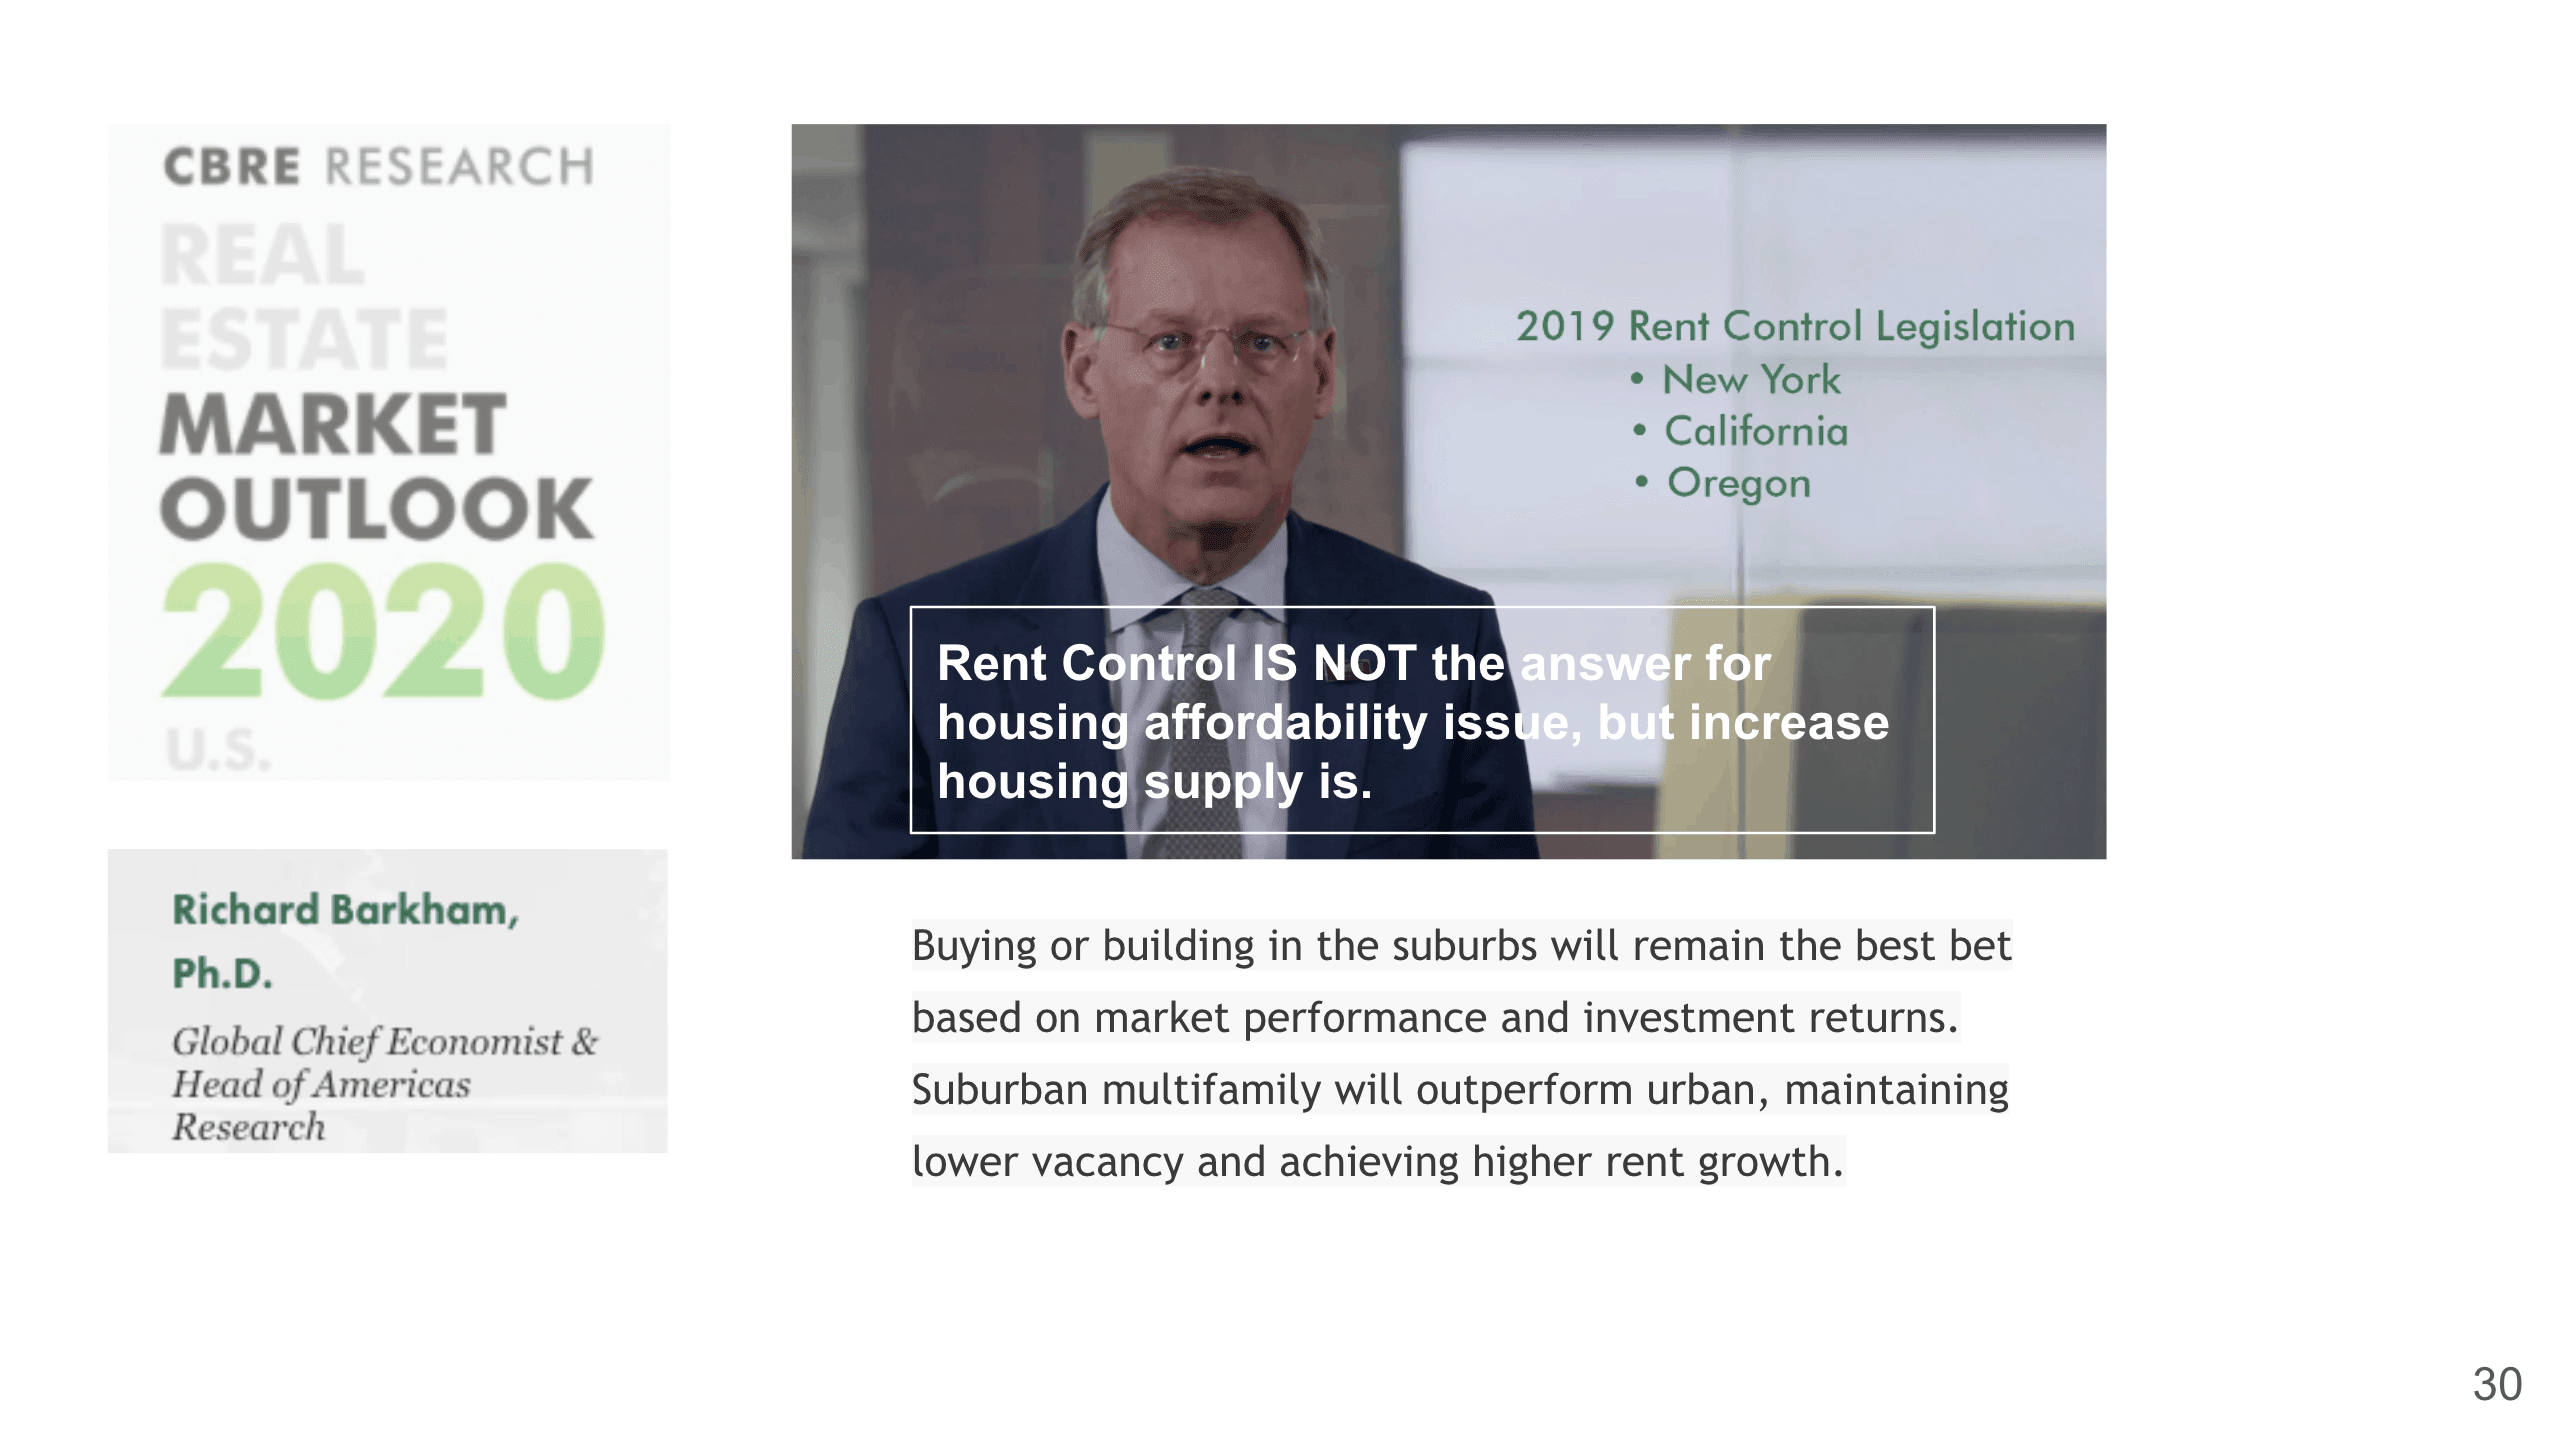
Here’s the CBRE Research on Real Estate Market Outlook 2020 by Richard Barkham, the Global Chief Economist. He was saying that the 2019 rent control legislation was actually hurting the markets and “is not the answer for housing affordability issue, but increased housing supply is”. As you see that we have some pretty strict rent control legislation in New York, California, and Oregon, and we continue to see that the stricter the rent control is in those areas, their rent actually historically has gone up more. He also says that:
“buying or building in the suburbs will remain the best bet based on market performance and investment returns. Suburban multifamily will outperform urban, maintaining lower vacancy and achieving higher rent growth”.
So if you’re looking for an investment property it is a good time to look in the suburb area.
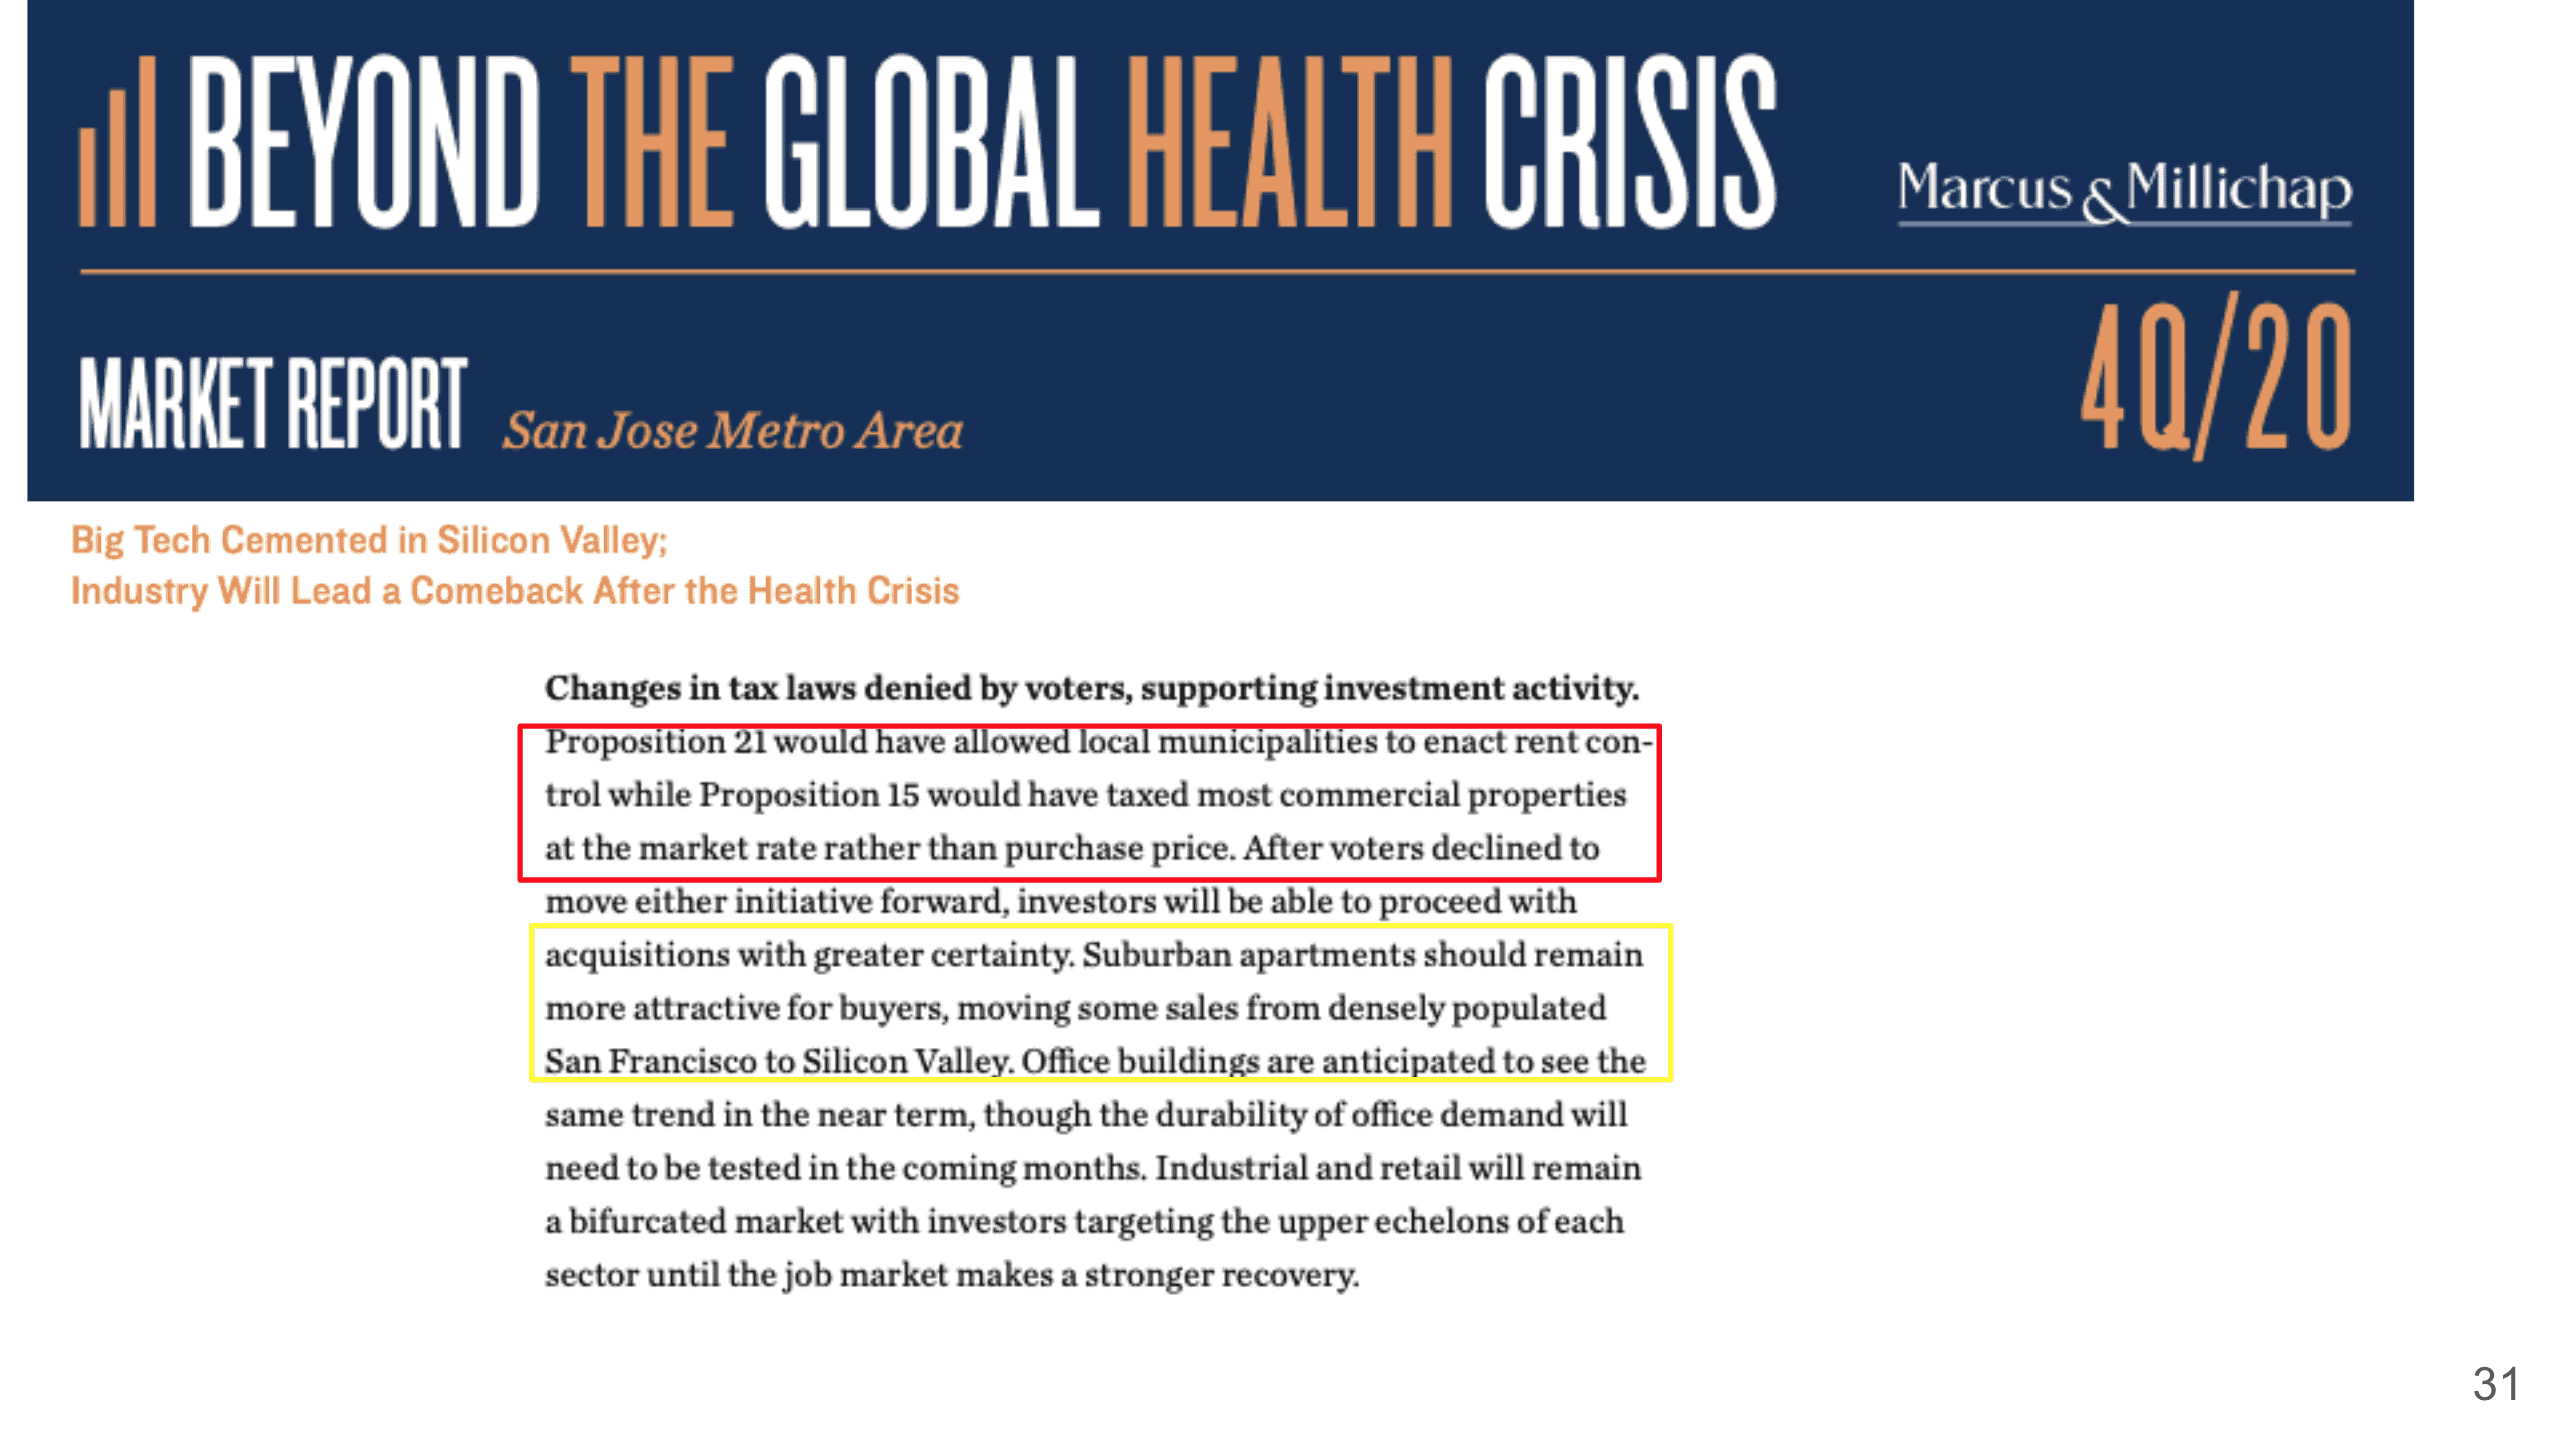
Marcus & Millichap also have some San Jose market reports, and they do believe that San Jose actually will lead the comeback after this health crisis. However, the changes in tax law have actually been denied by voters supporting investment activity. For example, Proposition 21 and Proposition 15, you know, they denied more rent control, and if they had passed Prop 15, it would have taxed most of the commercial properties at the market rate rather than the purchase price, which will actually, in turn, to cause a lot of consumer products to increase in prices.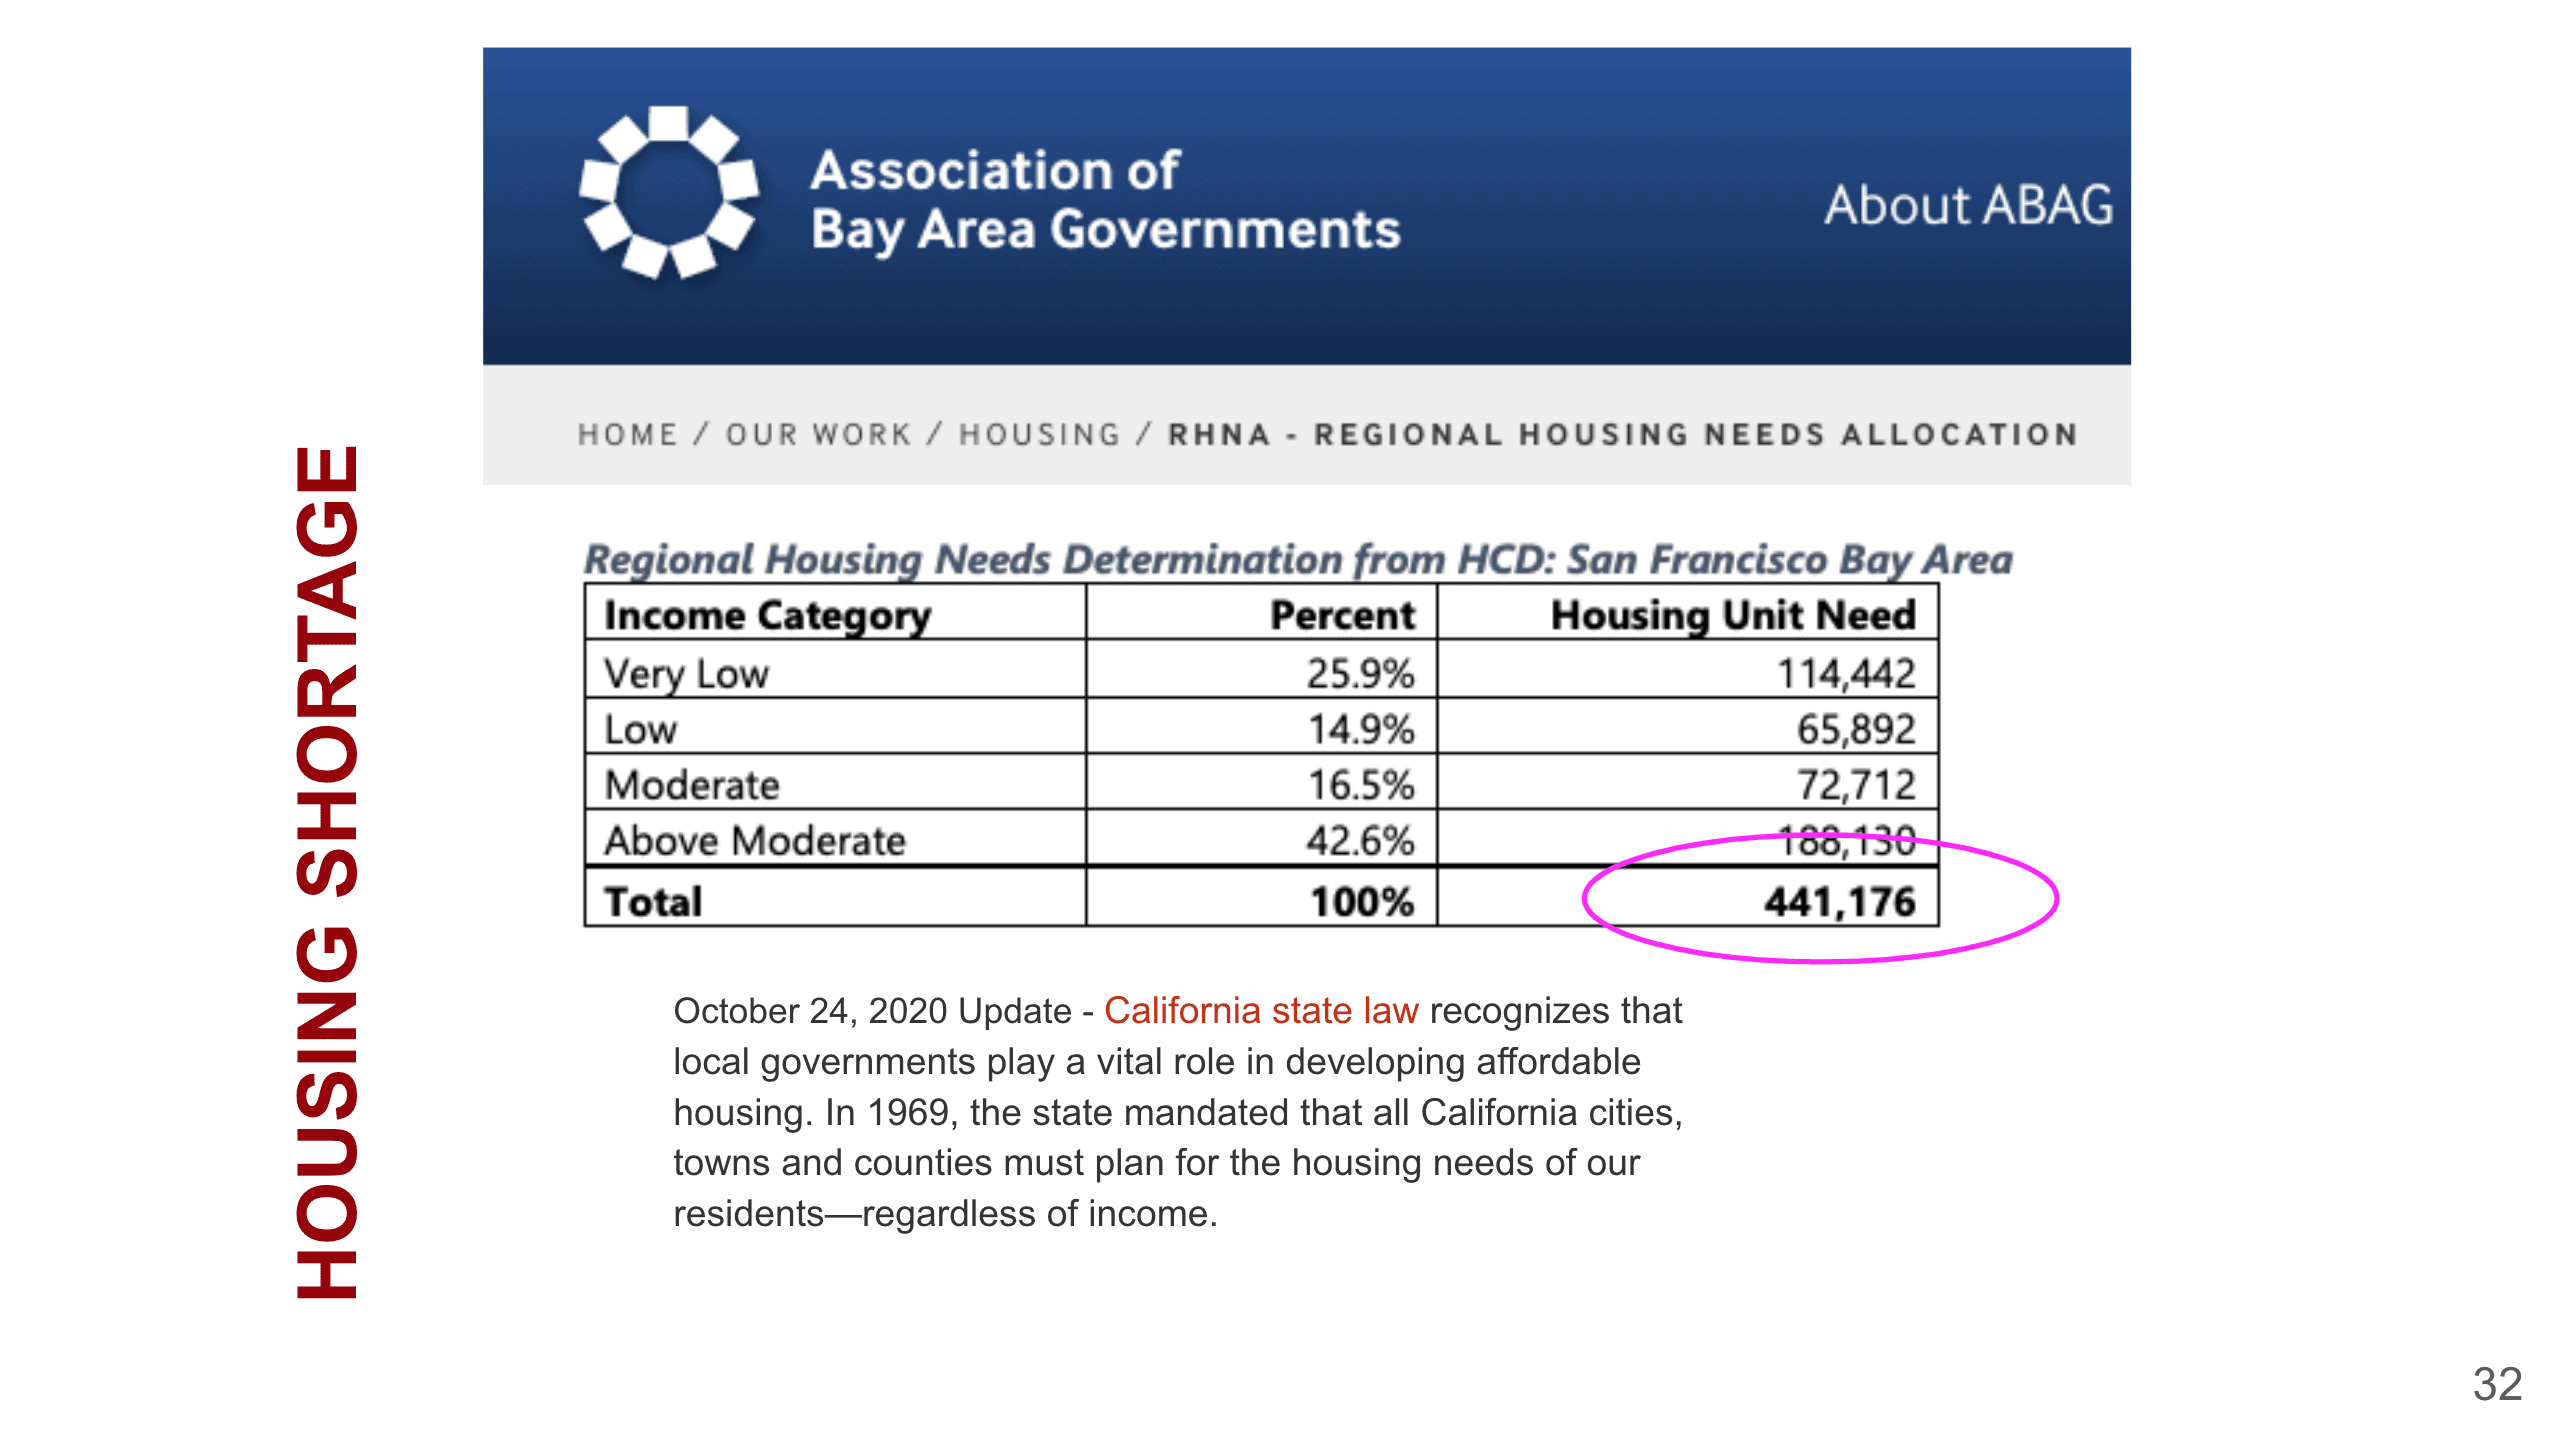
All right, so again we talked about the housing shortage. We are still 441,000 short in our housing unit in the San Francisco Bay Area.
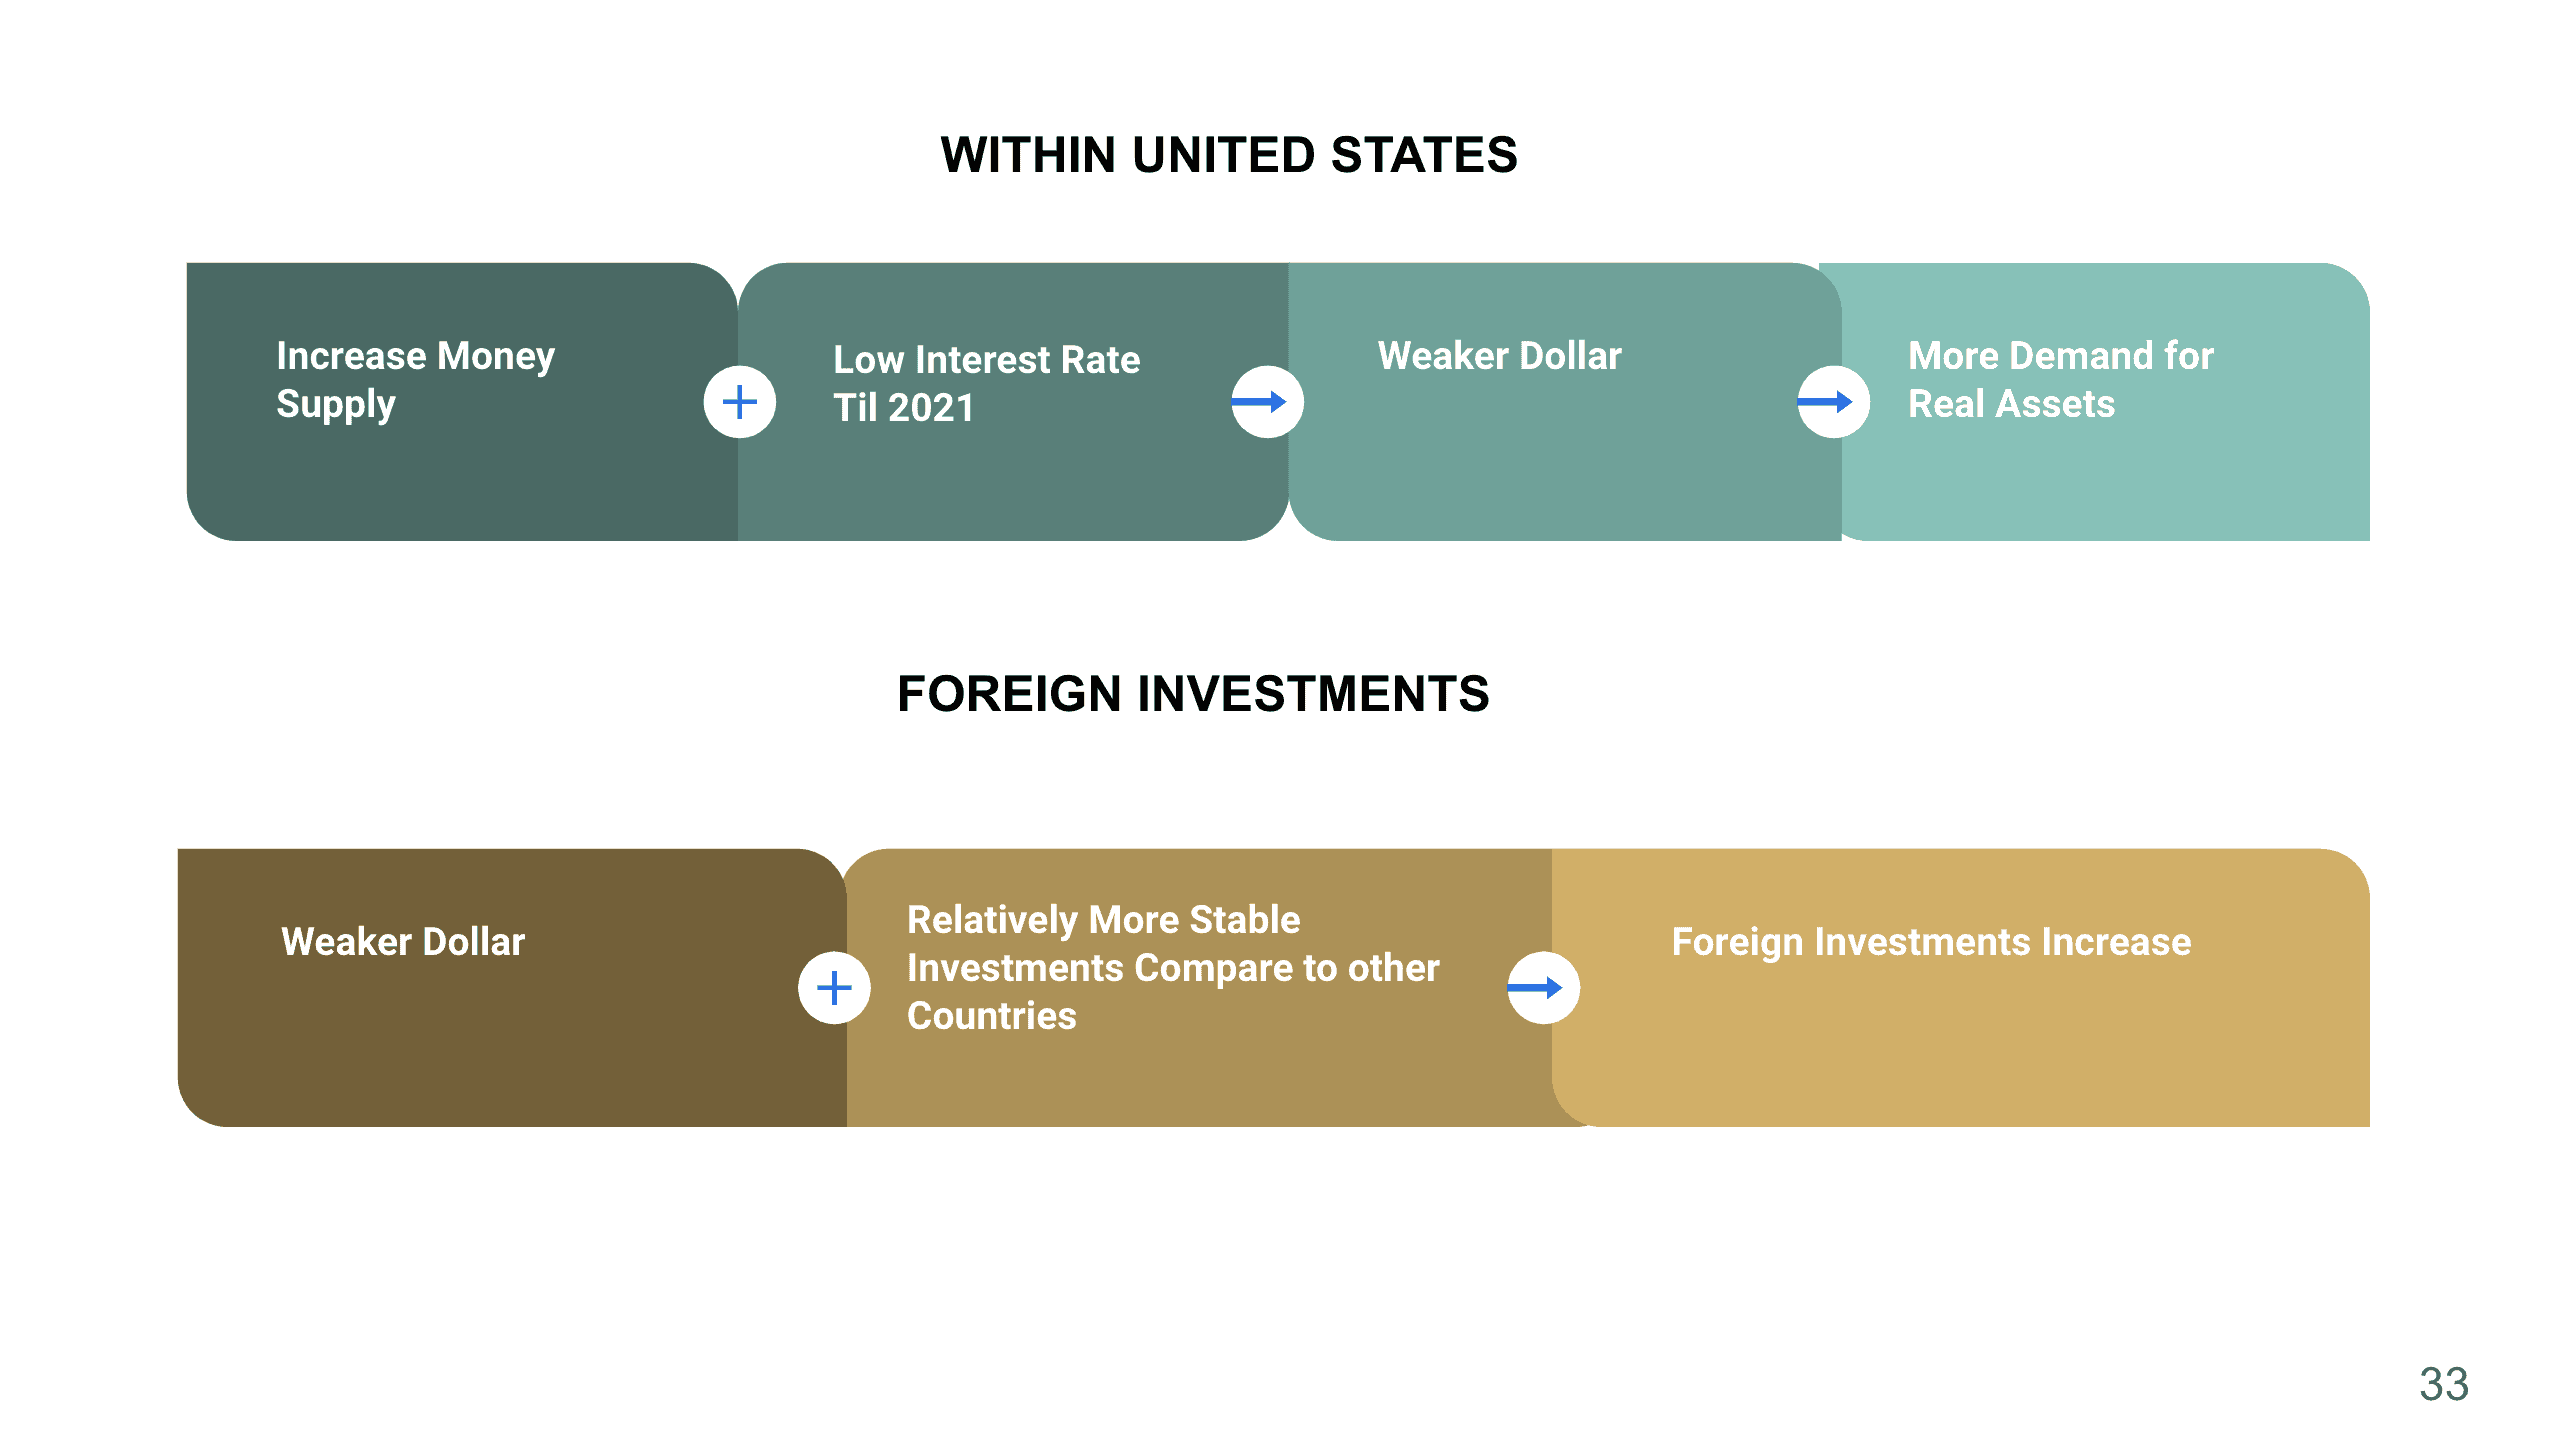
We talked about these charts actually last month. We mentioned that the money supply has been increased, plus the lower interest rate until 2021, which will cause the dollar to be weaker, and that’s also the reason why we have more people demand real assets. In terms of foreign investments, because of the weaker dollar and relatively speaking the U.S. is still a much more stable investment compared to other countries, so we are going to see foreign investments increase.
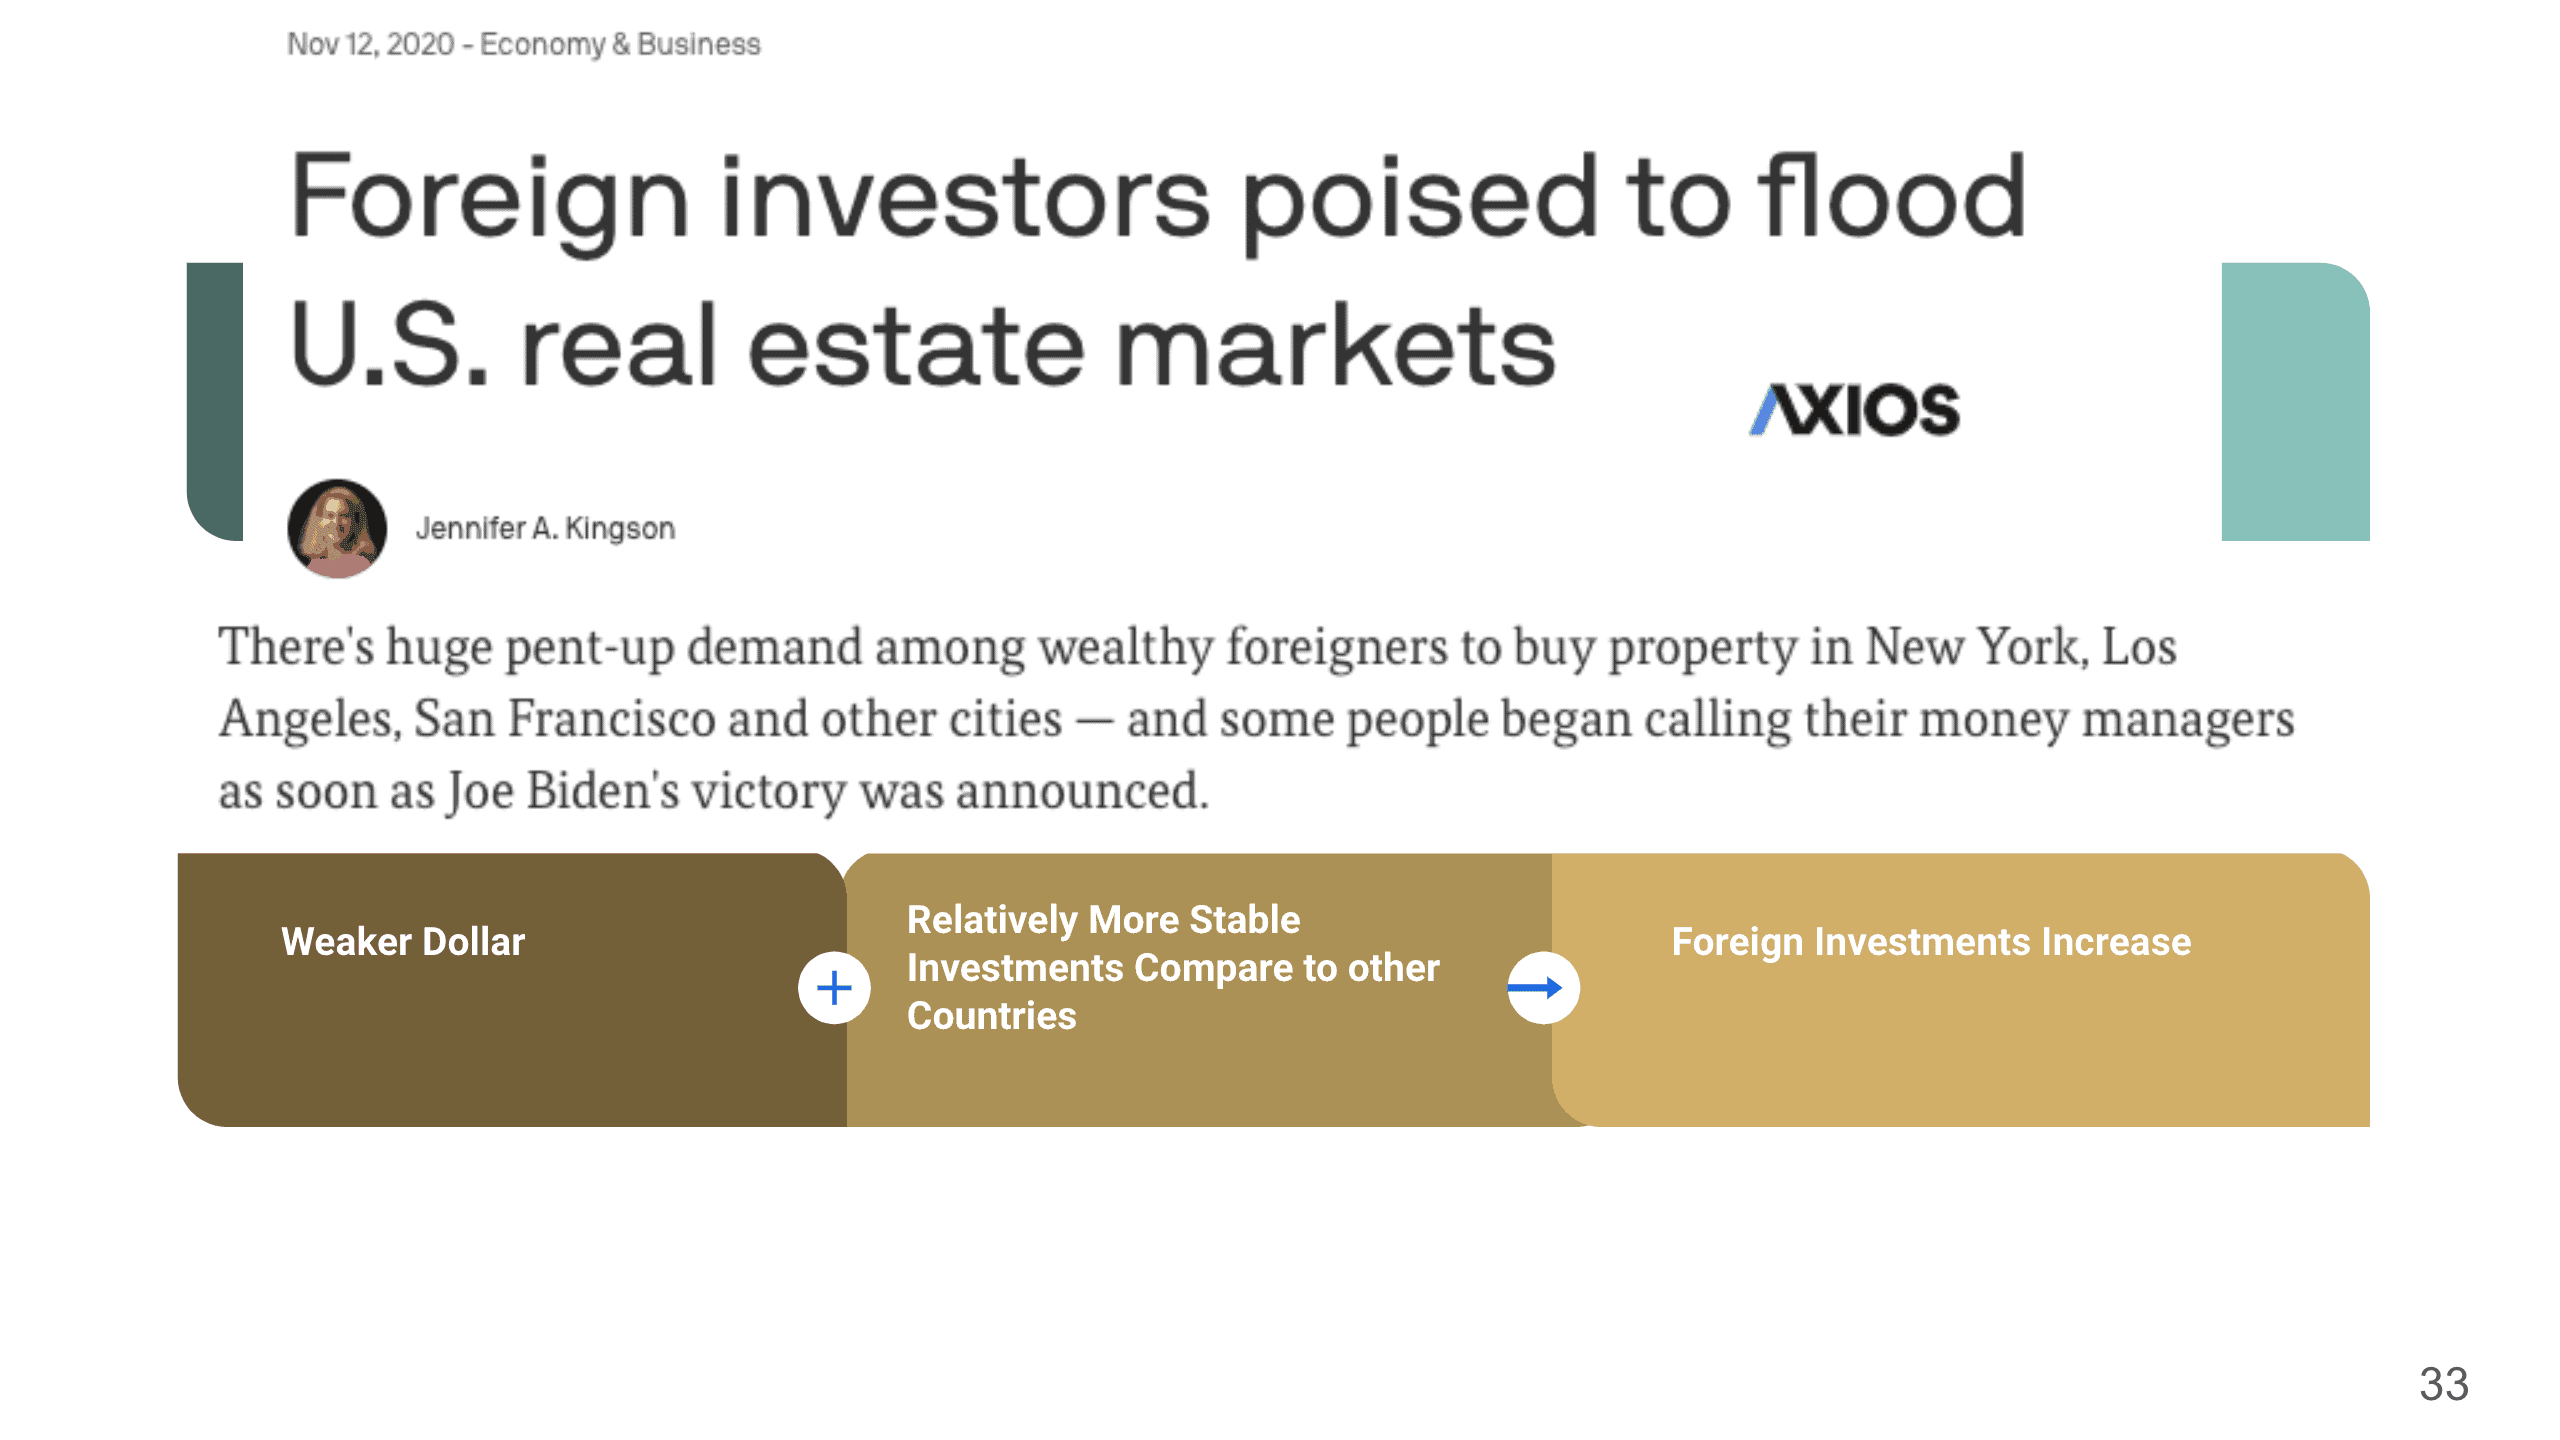
This was from last month’s slide, but I want to share with you this article I just found after my presentation last month. It says foreign investors poised to flood U.S. real estate markets, and “there’s huge pent-up demand among wealthy foreigners to buy property in New York, Los Angeles, San Francisco and other cities – and some people began calling their money managers as soon as Joe Biden’s victory was announced”.
I know that Joe Biden’s winning has caused a lot of people to wonder what is going to happen in terms of taxes because of his tax proposals. That’s one of the reasons why we also invited Tim Tikalsky, Tax Principle with almost 40 years of experience, to our Bay Area Housing Market Townhall Webinar. He shared his tips and advice on year-end tax planning during this episode, watch it here! We hope you find the information in this blog helpful, if you have any additional questions or comments, feel free to contact us or schedule a consultation!
Stay up to date on the latest real estate trends.
A Bay Area Realtor's approach to schools, neighborhoods, and long-term value for families making a move


Part 1 of HAYLEN's series on the 2026 CCIM Spring Forum in Philadelphia
You’ve got questions and we can’t wait to answer them.