December Bay Area Housing Stats Since Last Market Peak – Part 1
Welcome everybody to our 26th episode of our Bay Area Housing Market Town Hall. Let me go ahead and start on the state of the market, and I also want to review what has been happening in 2021. Watch the video recording here.
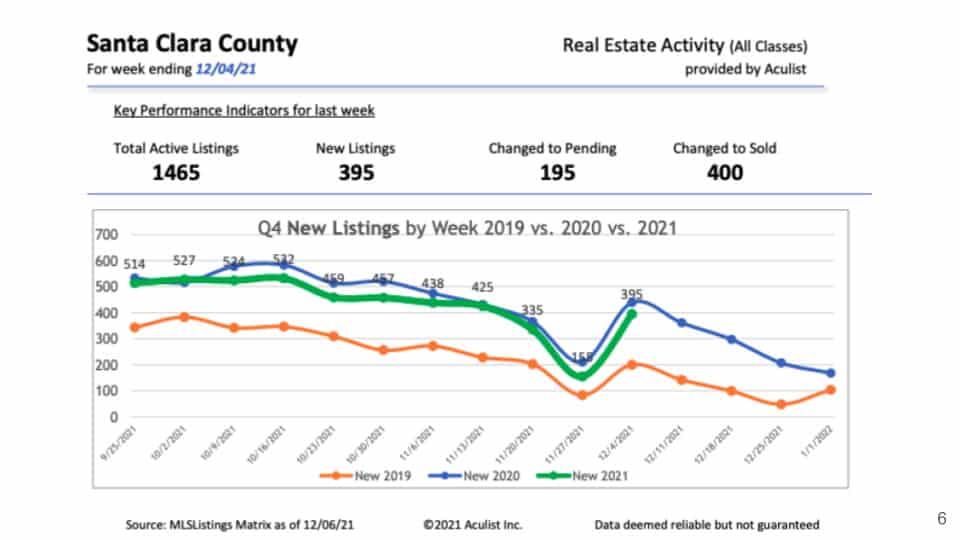
If we look at Santa Clara County, the orange line is 2019 numbers, and the blue line is 2020, and the green line is 2021. Most of us know that in 2019, our market was actually kind of slow and the price did not go up that fast and in some markets actually, dropped a little bit in 2019 and we always say that the price gets driven up because of low supply and high demand. But as you see that in 2019, we actually have lower supply compared to 2020 and 2021, but in 2020 and 2021, that is when our market has gone up quite significantly and one of the major factors obviously is because of the interest rate and mortgage rates have been very low and has encouraged a lot of people to buy. I just thought to show everybody that in 2019 even though the supply was a little bit lower and in Santa Clara County, the price was not going up that much and our supply was actually pretty good compared to 2019 and 2021 and also 2020 which is the blue line here. We are pretty close with each other, and we both see that all three years around November 27th, we have a dip in the new listings and this is because, obviously, this is the Thanksgiving weekend typically, so that’s why the listings have gone down around this time and they should back up about a week later. As soon as Thanksgiving is over, they should back up but then as December continues and you will see that the new listings will come down.
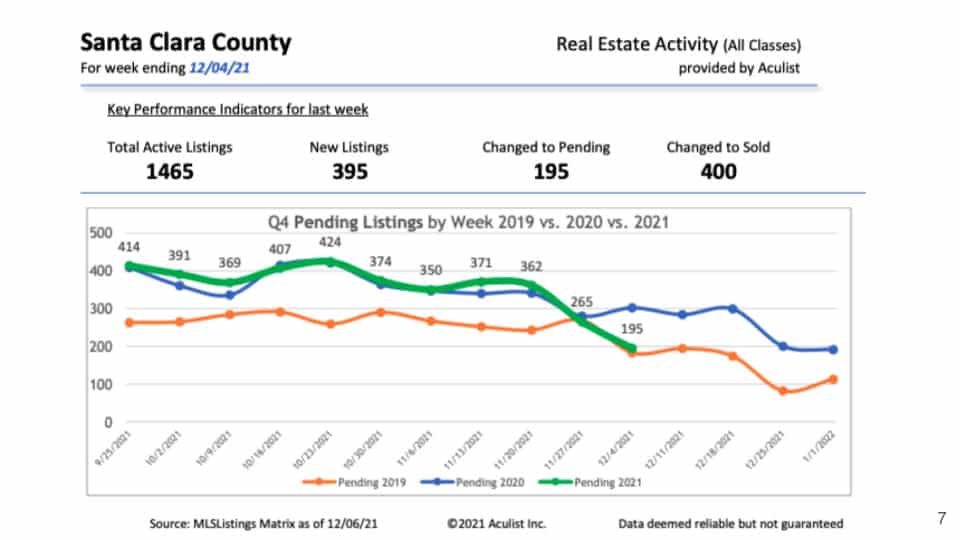
The same thing for pending listings in 2021 and 2020, we are pretty similar in numbers and as you see that around November 27th, again the number of pending listings have gone down. Pending meaning like that is when people got under contract around that time. Besides the fact that in 2020, after November, it has stayed pretty consistent, but then it did drop quite a bit right around the December 25th, that is around the holiday season, but I remember usually our December slowed down quite a bit. But last year in 2020, we were really busy, actually all the way through until January 1st. So, this year though we do see a little bit slower compared to last year and more in-line with 2019.
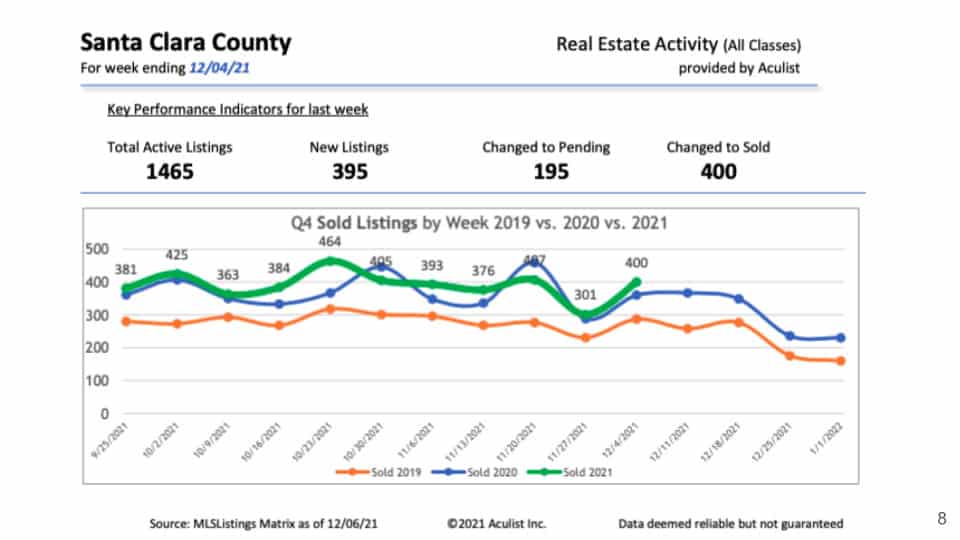
Here are the sold numbers and these are actually closed escrow, so when you look at these numbers, you have to backtrack about a month before right? because it takes about a month to close escrow. So, if you look at the orange line again, the number of closed versus the number of closed for 2021 and 2020, there are lower, and then typically around December again, we should back up a little bit and then dwindle down.
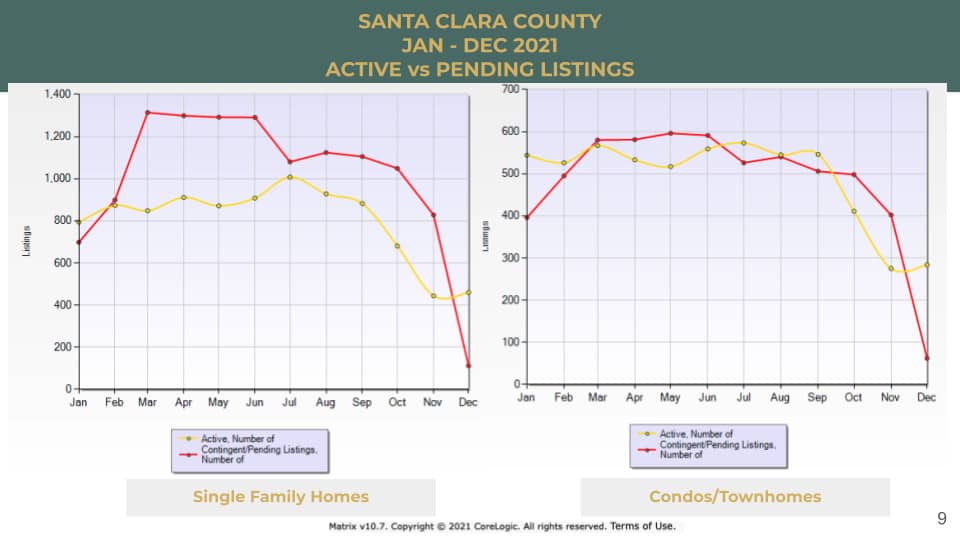
Let us look at what is the difference between the active and pending listings towards the end of the month and why is it so important to look at these numbers. Because when we look at active numbers for both single-family and condos, the active numbers are down here for single-family, but then the number of contingent impending meaning that we have so much demand whatever comes out would pretty much gobble them up and then go under contract. But, then as December comes around, you started seeing that the contingent and pendings have slowed down quite a bit, even though we still have some listings coming up and that is why you start seeing the market slow down a little bit and certain markets is still crazy. We still have a lot of multiple offers, but you do definitely see a lot of markets in different neighborhoods, started slowing down and the same thing for condo markets as well.
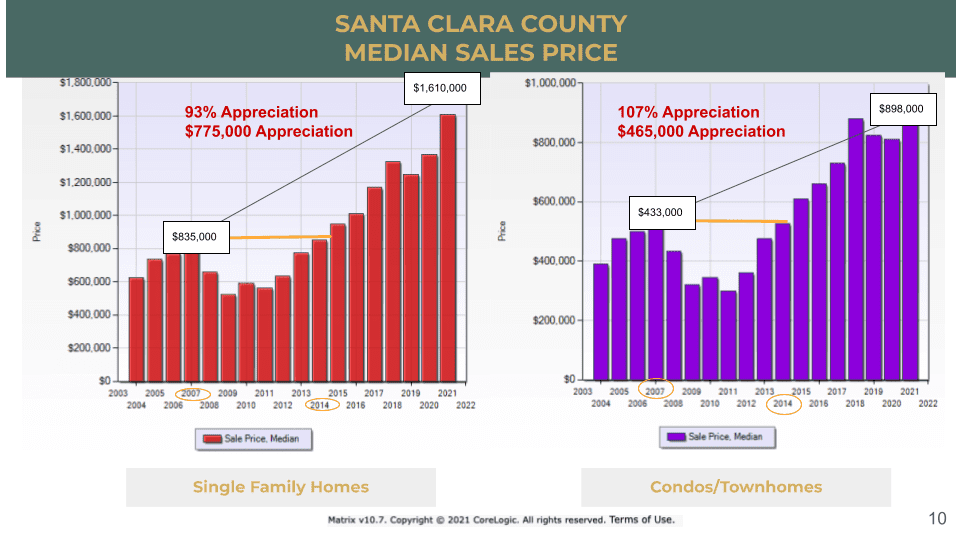
Now, let’s look back to the median sales price and how it has changed since 2004 and in 2004, you see that the median sales price in Santa Clara County is just slightly over $600,000 and then the peak, the last peak we had before the recession, before the market actually dropped, was about 2007 and that was slightly over $800,000 and then it took about 7 years to go back to around the same level which is 2014. If you compare the last peak to this year’s, how much it has gone up. The last peak was at $835,000 and now our median sales price at $1.61 million and this is about 14 years and that is equivalent to 93% appreciation since 2007, even we had the second greatest recession in history because of the mortgage crisis and if you had bought something back then, you probably averaged, it has gained about $775,000 on the appreciation. So, if you look at it this way, it is kind of like okay, if you are holding a property long-term, I hear a lot of our clients say, “Well, we want to hold our property for at least 10 years, 15 years.” If this is for your own home then, we always encourage our clients like really look at the market and you are not going to go wrong. It is more important to come in and buy that home for your family because of the stability because of the sense of security and also of course, if you are talking about economically is that the mortgage rates. Your mortgage payment is really low because of the low mortgage rate. I want to show you guys this drastic difference because if you imagine some people bought in 2007 and then in 2009, they said like “Gosh! you know I bought at the peak,” but now they are very happy because they had gained so much appreciation because they did not sell and they have kept it. The same thing for condos, I know some people also say like, “Well, condo is not as good of an investment.”
Let us look at the difference between the condo and single-family. Now, if you look at condos, the same thing, the last peak is around 2007 and then it waited about 2014 to hit around the same price point and now comparing to 2007 and today’s median sales price, back then is $433,000 and today is $898,000 and that is 107% appreciation – that is $465,000 appreciation. Dollar amount-wise, yes it is not as much but obviously, you started much lower too, but then the percentage-wise, actually has gone up even more than a single-family. I thought this is really interesting to look at because I think a lot of people do not really look at it that way. They just really worries like, “Oh, I don’t want to buy at the peak.” I always say, if you are buying this for your family, if this is a long-term thing just hold on to it and hold on to that 30 years mortgage payment that you can get, right now, at this low mortgage rate.
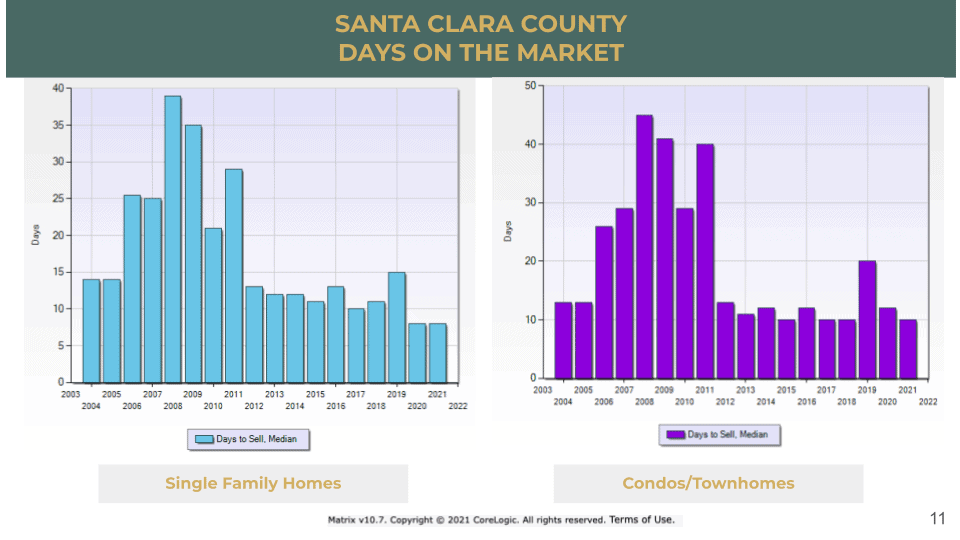
Alright, let us take a look at something else, here are days on the market. Single-family days on the market, if you look back at the worst time, again the recession, it has gone over 35 days, almost 40 days on the market for single-family. While the condos, it was actually a little bit longer, it is 45 days around there. But now, pretty much both, single-family and condos, they are less than 2 weeks on the market only and then again remember, just now we talked about 2019, the supply was lower but then the price also did not come up as much and the properties were on the market longer and the time was like about over 2 weeks’ timeframe. But, now 2020 and 2021, they are both like less than 2 weeks on the market.
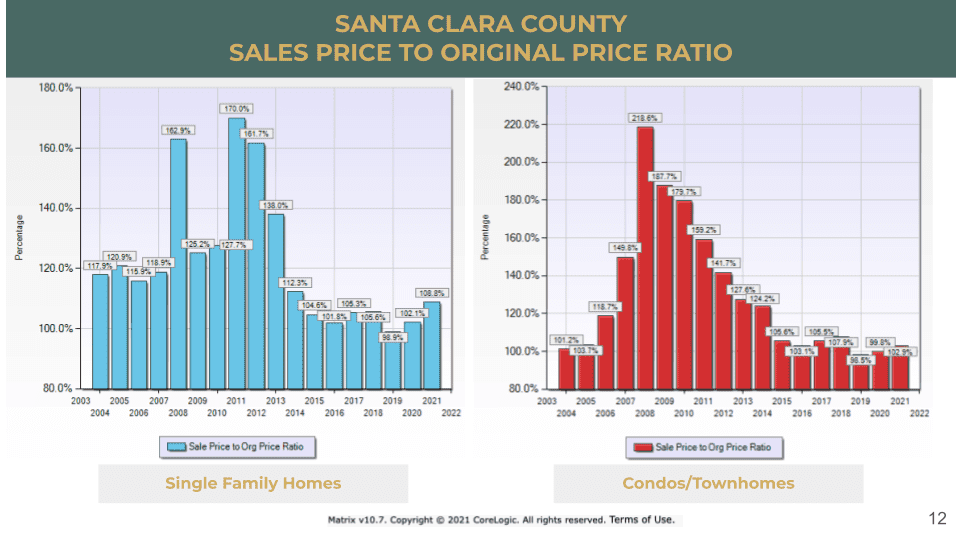
In terms of how competitive it is to bid for the property, that is the sales price to the original price ratio. I thought this is really crazy. I think people did not really expect to see this, especially during the recession time. I mean during the recession, we are still talking about way over 100%, meaning your sales price is actually way higher than the asking price. But, I just want to make sure you know that this is the original price, and meaning that this is the first listing price that came out on the market. Well, I have to say that some of these numbers probably skewed because at that time, there was so much REO, so many short sales, and then their strategy was a little bit different back then, but still, you see that both condos and single-family, it has almost always been like over a 100% asking, besides 2019 again slightly lower. That was the one year, I remember, a lot of buyers who came to our open houses said that they are going to wait until 2020 because the market was going to crash because that is what they saw on YouTube and as you and I know now, the market did not crash; on the contrary, the market has gone up significantly since 2019. So, this is something that I thought was interesting to show.
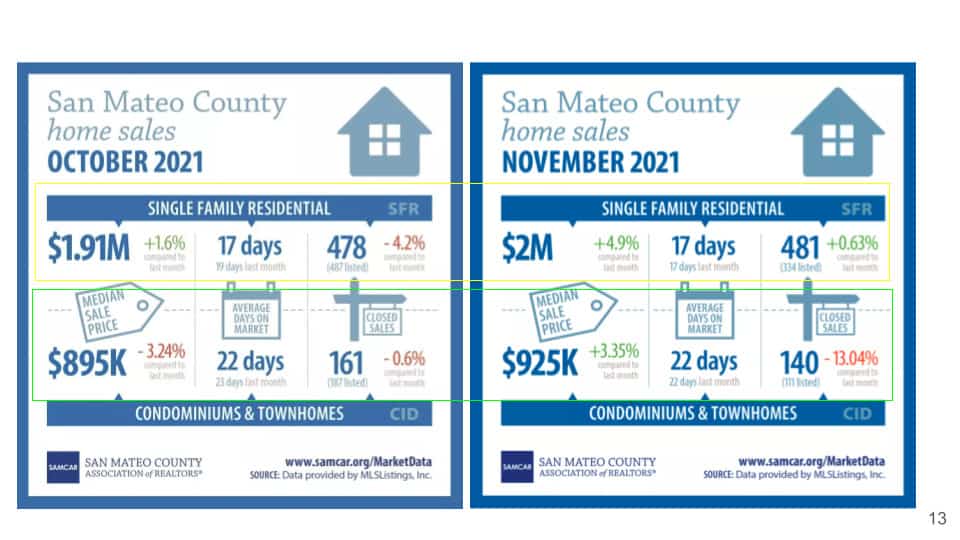
Now, let us move over to San Mateo County which is on the Peninsula side and I was like, “Oh, my gosh, it has broken the 2 million dollar median sales price this month for single-family and still about 17 days on the market, it is just about slightly, slightly more number of units listed and in terms of the condo and townhomes, it also has gone up to $925,000. It is also still at 22 days on the market. It has a little bit less inventory, but then, we still have about 140 units closed.
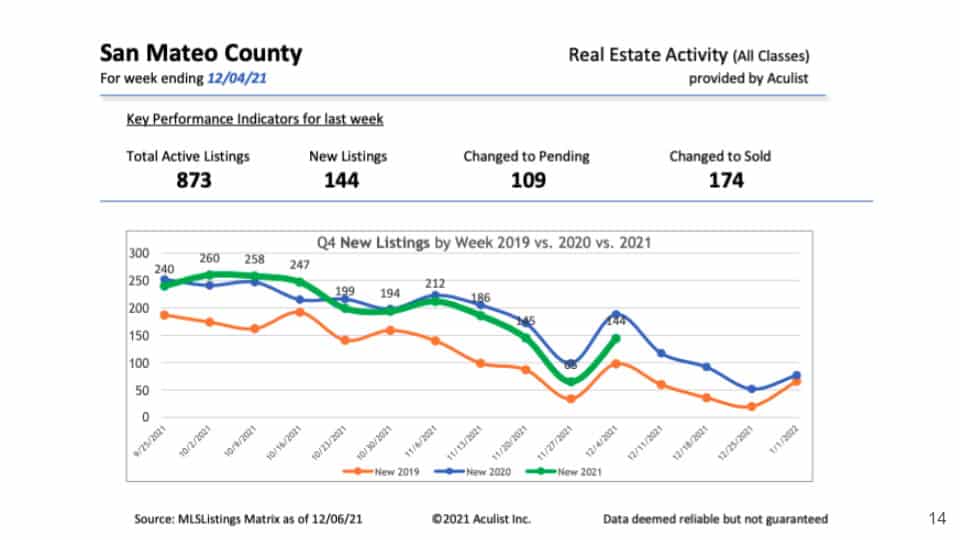
The trend is very similar. I am just showing you guys here because it is almost the same as Santa Clara County. The 2019 level is slower than the 2020 and 2021 levels. The same thing, the thanksgiving weekend inventory dropped.
Throughout the Counties, we have very similar charts that we are showing you guys, so you can see the trend. I know, there are a lot of people who always ask about, when is a good time to buy and when is a good time to sell. You can always know that around the thanksgiving time frame, this is when the number of listings comes down. For the buyers, while we advise the buyers, is that November and December is truly the best time to go look for properties. I am not saying that you will be the only one on the market, but the competition level is going to be so much less and that there is a lot less listings as well. So, you may not be able to find that perfect home for you; but in case you do, this is the time that you are actually not competing with too many people.
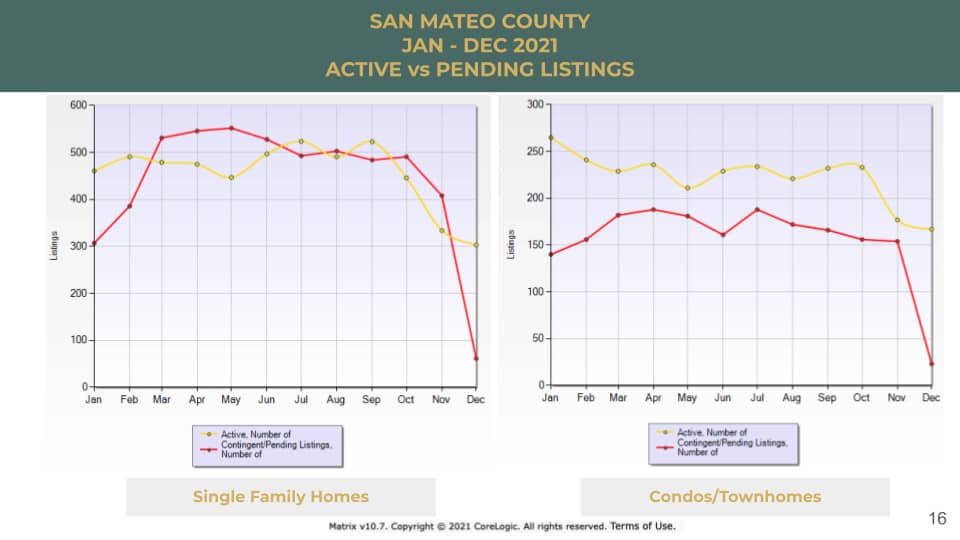
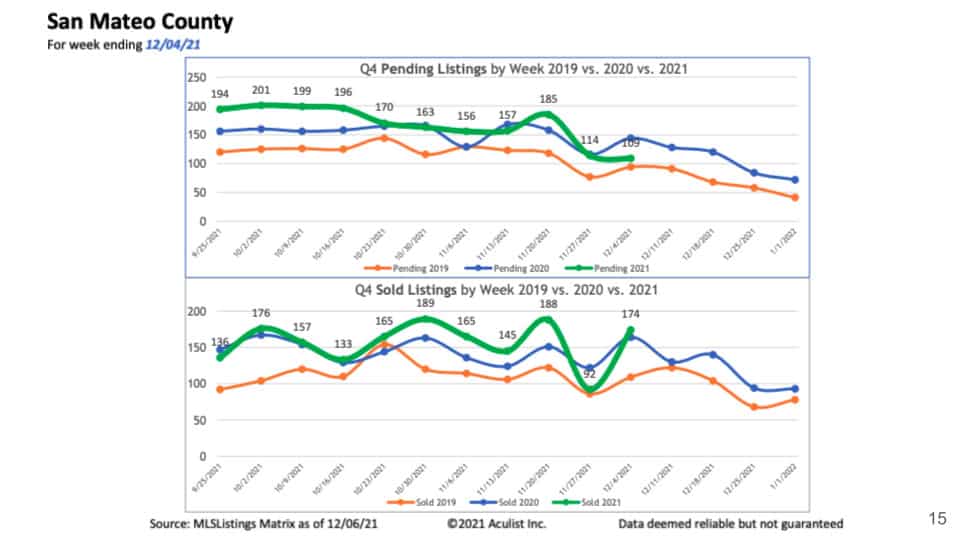
Let us look at the same thing here is interestingly, in San Mateo County, you will see that number of active listings – the yellow line and also the pending listings which is the red line. They are kind of like, at first they have a lot that whatever comes out on the market they just absorb it, and but you look at last year, there were actually more listings and they did not have as much pending. I am not sure if you guys remember but you know we have been doing this for about 2 years now. Last year when we looked at San Mateo County, the pricing was actually not as strong and actually had come down because we noticed a lot of people were kind of moving away from San Mateo County because they were expensive, and now, that you see that the market has gone back up and then that is why, you will see the pricing has been going back up, but last year, the pricing actually came down a little bit, especially for the condos, you can see pretty significantly. But, if you compare the condo/townhomes versus single-family, now you can definitely see how different it is with the number of active listings here versus a number of contingent listings, meaning how many properties have gone under contracts. So, earlier we saw that a lot of these is like whatever comes out they have gone under contract, but then you see that there are actually more inventories compared to what is being absorbed.
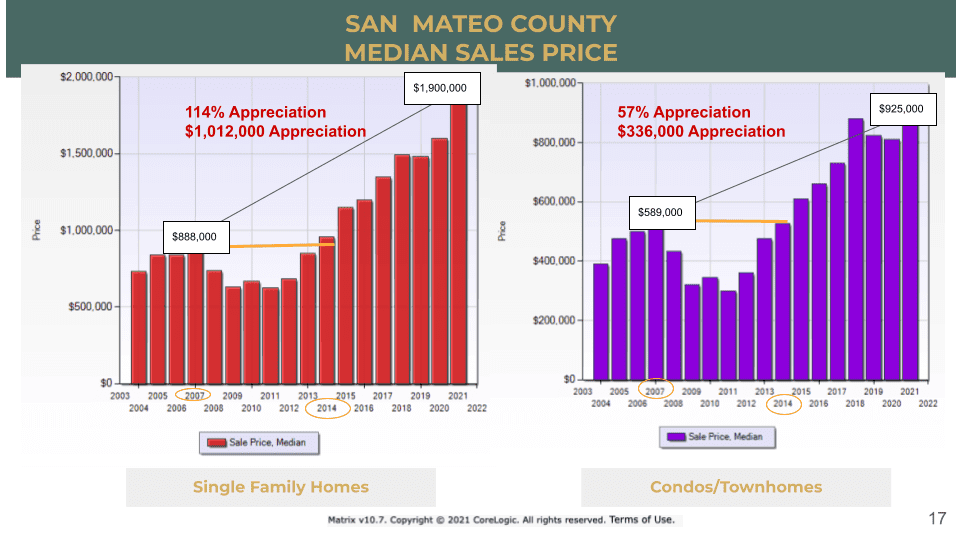
Here is again the median sales price for San Mateo County. If you had bought in San Mateo County back in 2007, which was the last peak before the recession, you look at and also compare 2014, not only it has reached back to 2007 level, actually has gone up a little bit as well and if you compare the pricing, the median sales price back in 2007 was already $888,000 while the median sales price for 2021 is $1.9 million, which means that was a 114% appreciation and you had just gained $1,012,000 appreciation in value even though you had gone through one of the worst recessions on the market and as for the condo market and townhomes market, the same thing 2014 came back up to the same level and I look at 2007, it was $589,000 median sales price and in 2021, that went up to $925,000 which equivalent to 57% appreciation and that is $336,000 appreciation. It is actually a little bit less than Santa Clara County interestingly, I thought San Mateo County at first for their condo/townhomes would have a higher appreciation, but even though their single-family has a much higher appreciation, the condo/townhomes, on the other hand, did not have as much of an appreciation compared to Santa Clara County.
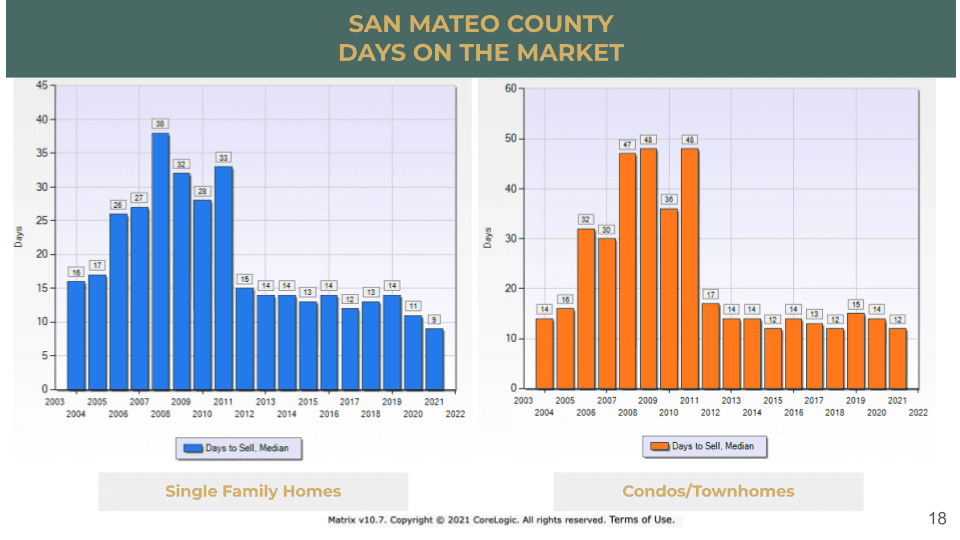
In terms of days on the market, it is about 38 days and now it is just 9 days, the same thing for condos. Back in 2008, the worst time was 48 days, now it is about 12 days and it has been like this less than 20 days since back in 2012. And, you see the big drop, it is like 2011 and then something happened, like 2012, it just dropped. All of a sudden, the market just came back up. We are all ready to buy. I remember very distinctly at 2012, just like what happened all of a sudden, the market is really active again.
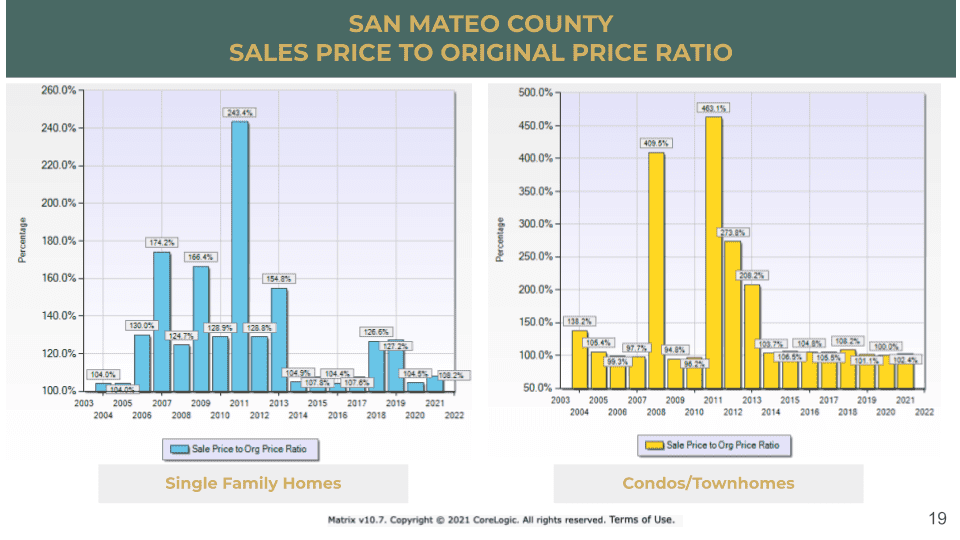
As for the sales price to original price ratio in San Mateo County, again, I thought my chart was wrong earlier, but when I did it for different counties, this is the same thing and they are just all over 100%. It has always been very, very competitive, always a high demand, but back then, we had a little bit more of the REO, short sales on the market, and then, this is like 2013 to 2021, these are more of the regular market where you are not dealing with the banks, you are actually dealing with the sellers themselves. But from 2008 to 2011, a lot of our listings on the market at the time, were all short-sell or bank-owned properties.
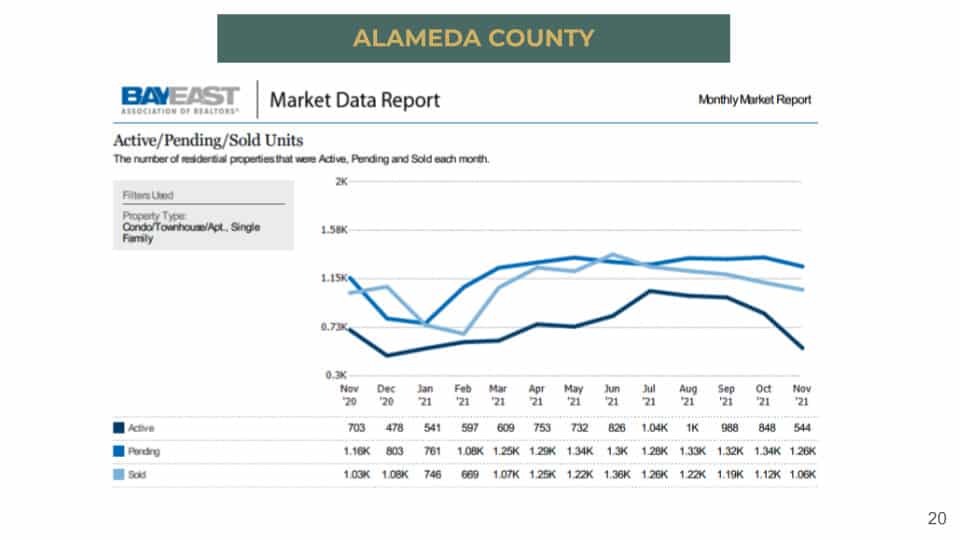
In terms of Alameda County, a similar situation with the active/pending/sold. I am not going to go into it too much because we are following the same trend.
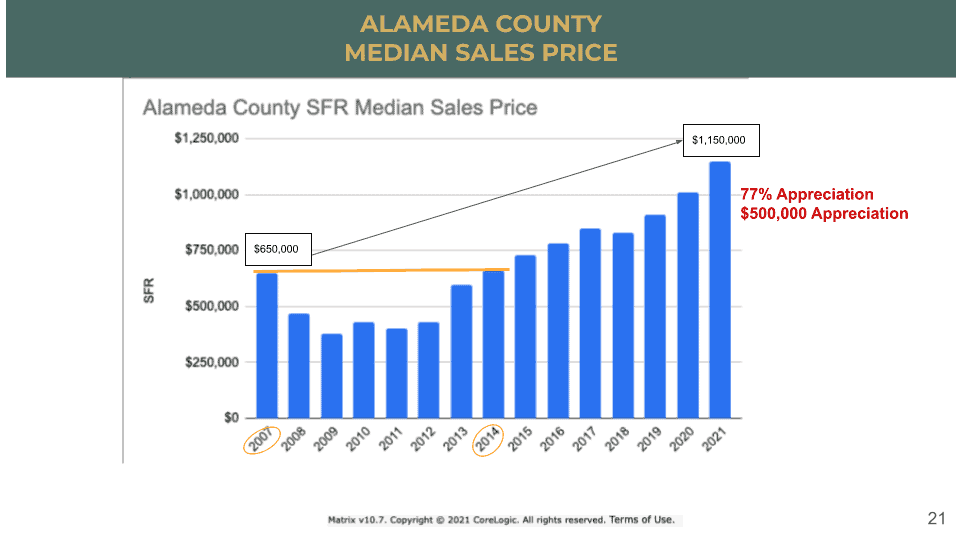
But, I definitely want to show you guys in terms of the pricing as well the median sales price in 2007 that was almost about $650,000 and then in 2021 it is $1,150,000 which is 77% appreciation or equivalent to $500,000 appreciation for the single-family.
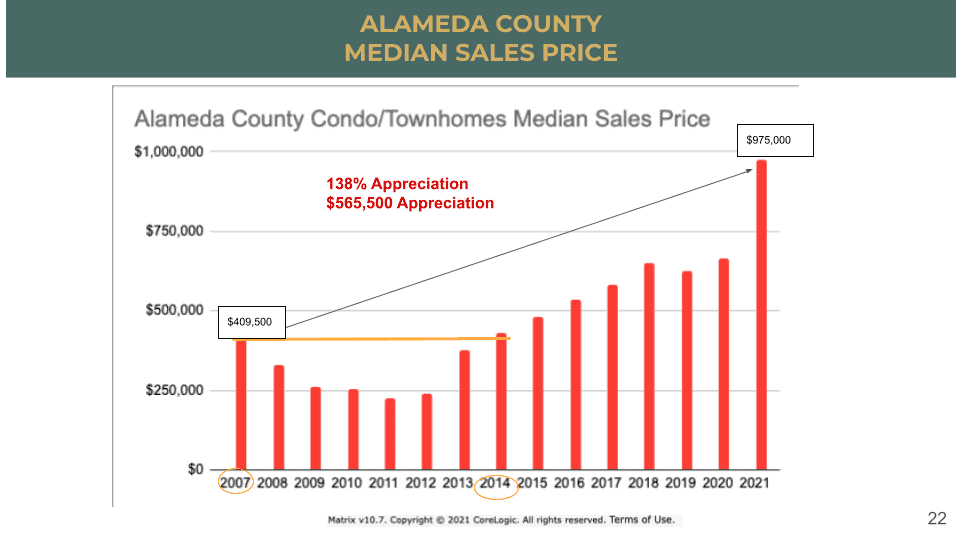
While condos, it has gone from $409,500 to $975,000 and that is a whopping 138% appreciation and $565,500 appreciation value. Again, Alameda, I think a lot of people are really shocked about this too. It is like “Wow! That is 138%.” I am going to show you guys later, much later in the chart, when I started looking at all these numbers I thought, it is really interesting, especially, if you think about you are not really paying cash for these properties, you are only paying 20% then you are going to look at really what is the actual percentage of return-on-investment that you are getting. So, I hope this is interesting for you guys to look at.
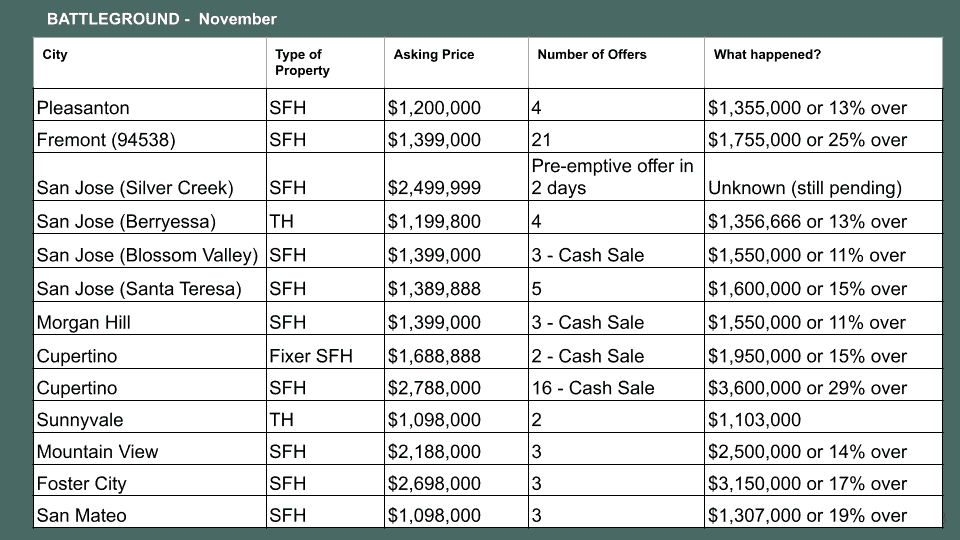
We also want to share with you some of these properties in the area I am trying to share with you guys. If you look back to last month, a lot of these number of offers here, they were all double digits and then you see that November now has only 4 offers, 3 offers, there are some that is Cupertino and these have 16 offers and so it depends on the area. Some of the areas are still very, very strong; but in some areas, you do see that they are slowing down. They are not as competitive as before where we see double-digit number of offers. So, I do not know how many times I have to remind people that if you are really looking for something, do not stop it during this holiday season. I know it is frustrating when you do not see a lot of listings on the market but do not stop because this is a time when you will find something, you are not competing with a lot of people out there.
Hope you enjoyed this month’s bay area housing market updates part 1, check out part 2 here! Please be sure to subscribe to our YouTube Channel, so you will get notified once the next episode is available. Finally, if you have any questions, please feel free to reach out to us, we are happy to assist you with any real estate needs.
Stay up to date on the latest real estate trends.
A Bay Area Realtor's approach to schools, neighborhoods, and long-term value for families making a move


Part 1 of HAYLEN's series on the 2026 CCIM Spring Forum in Philadelphia
You’ve got questions and we can’t wait to answer them.