December Newsletter – Silicon Valley Market Updates

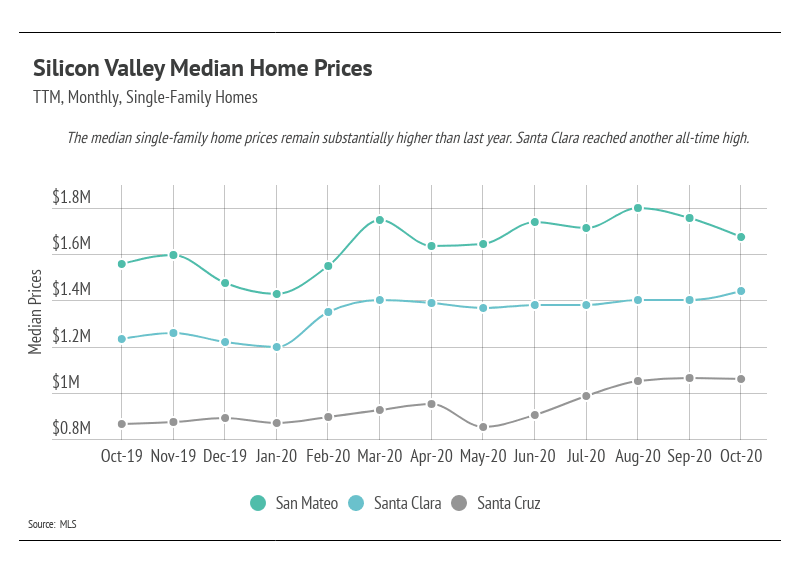
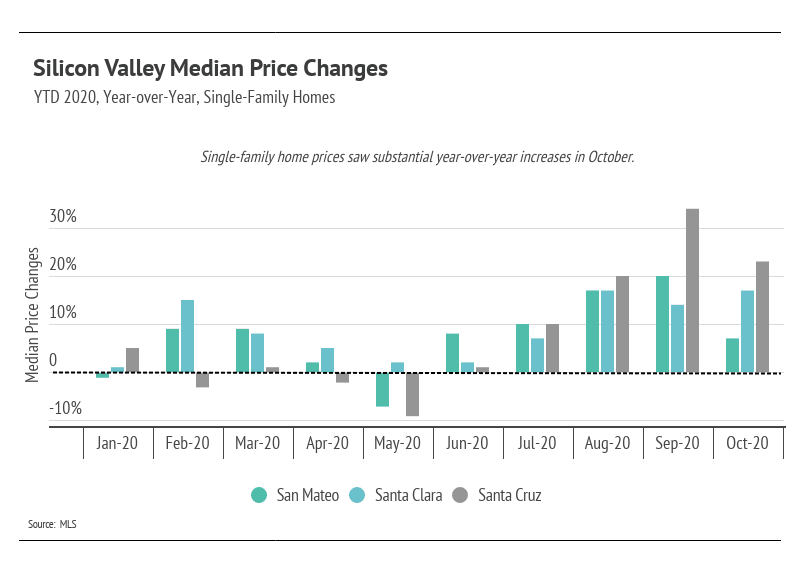
The median single-family home price had large year-over-year gains, despite a month-over-month decline in San Mateo. The Santa Clara median single-family home price reached another all-time high, while Santa Cruz is just slightly off peak.
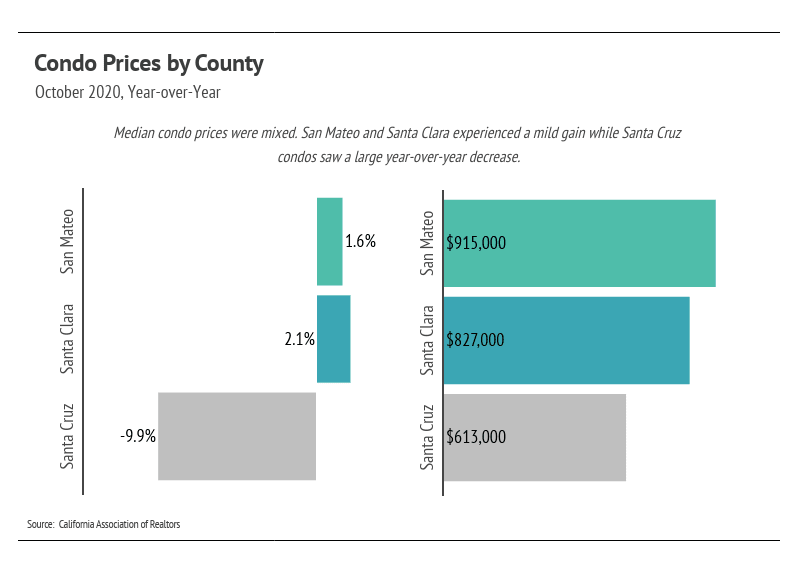
As you can see in the graph below, median condo prices were mixed across counties. Santa Cruz was notably lower than last year, while San Mateo and Santa Clara were flat.
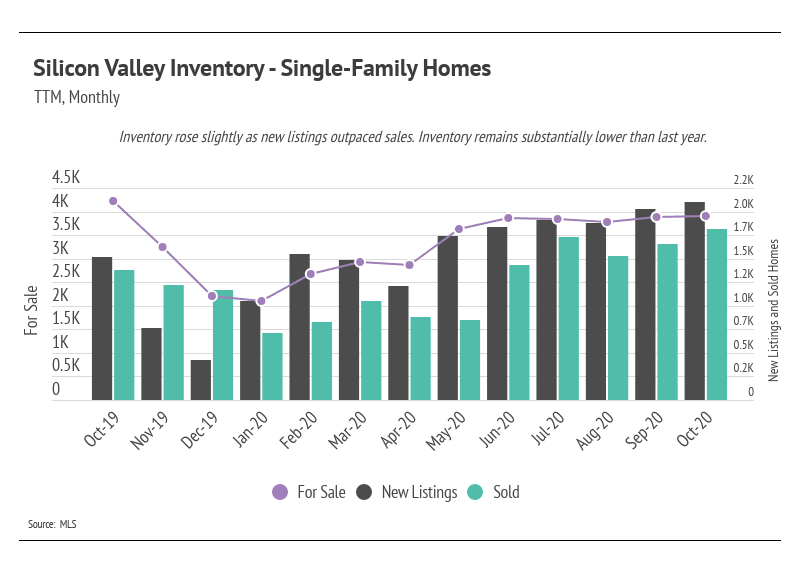
Total inventory continued to rise as the number of new listings outpaced the number of sold homes. Despite the increase in inventory, Silicon Valley is still undersupplied. Like the rest of the country, demand is outpacing supply, which buoys Silicon Valley home prices.
Single-family home sales have climbed since the initial months of the pandemic (March through May). Generally, buyers and sellers left the market in April and May, causing pent-up demand. Since May, sales have increased and are at their highest levels this year for both single-family homes and condos. Usually, we expect sales to decline in the autumn and winter months, but this year’s summer selling season was delayed and seems to be spilling well into autumn. Single-family home inventory is lower than last year, and is likely to decline as we make our way into the winter months.
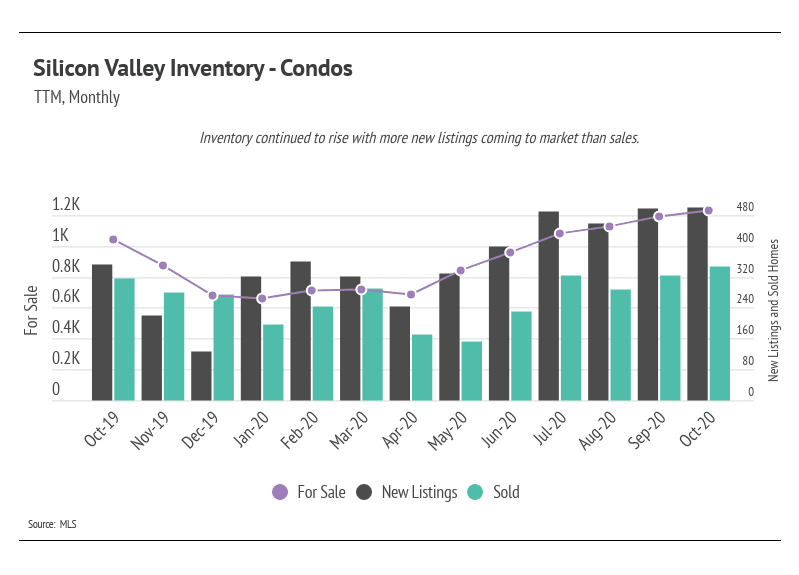
The number of condos on the market has risen fairly consistently since May. New condos coming to market have outpaced sales significantly, even though sales also rose, causing inventory to climb to higher levels than last year. In October, condo inventory was 18% higher than it was one year ago.
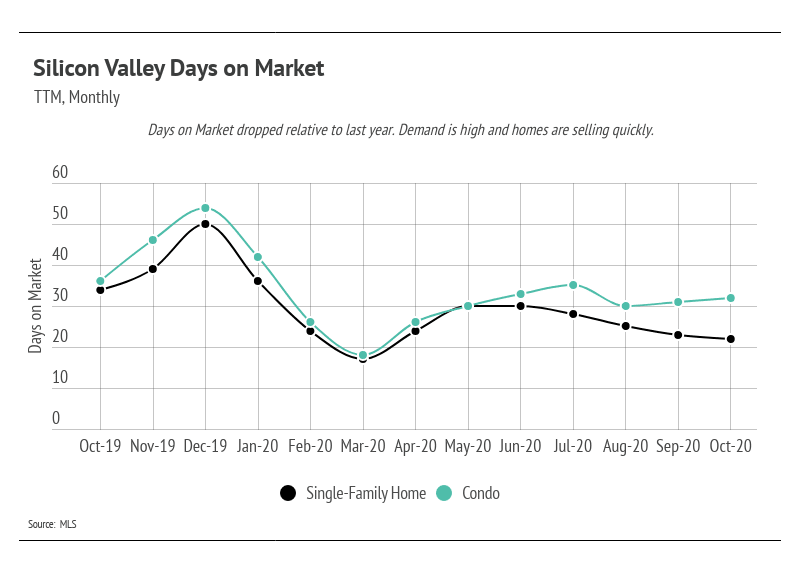
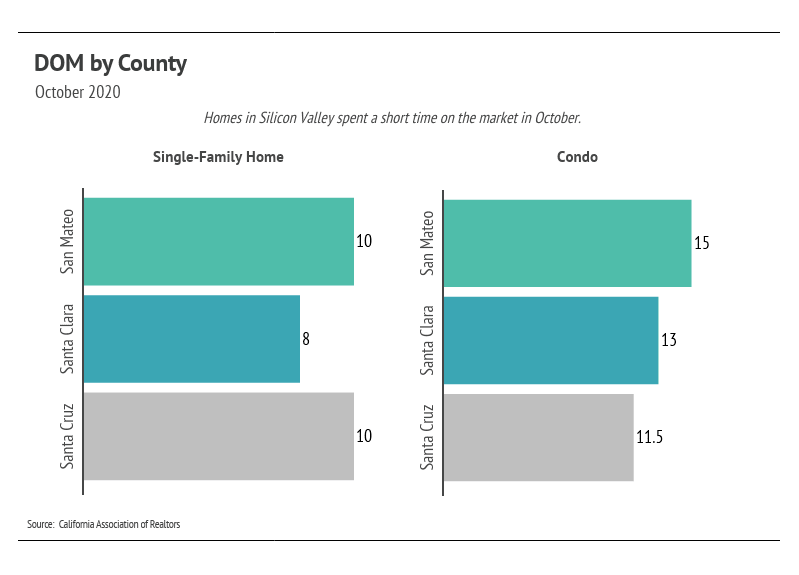
As mentioned earlier, we continue to see the Days on Market (DOM) fall due to rising demand and speedier processing through technological advances. The pace of sales affects MSI and has contributed to the low MSI over the past several months.
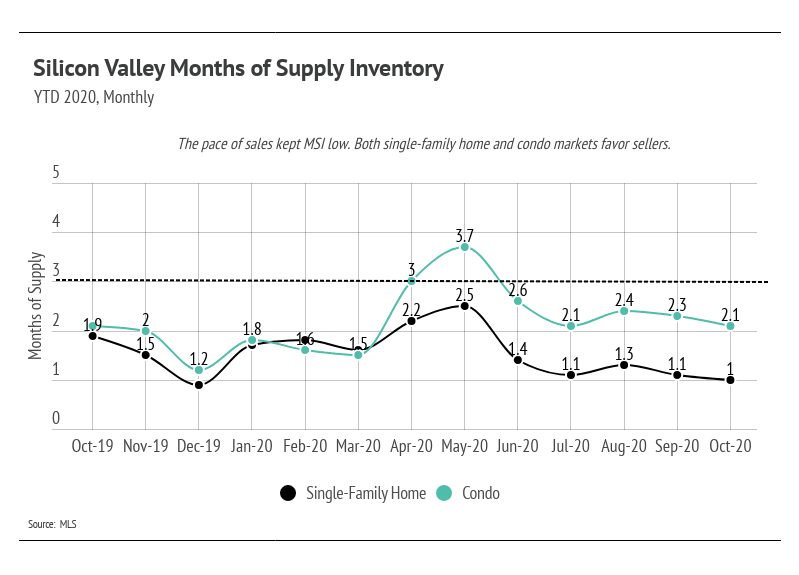
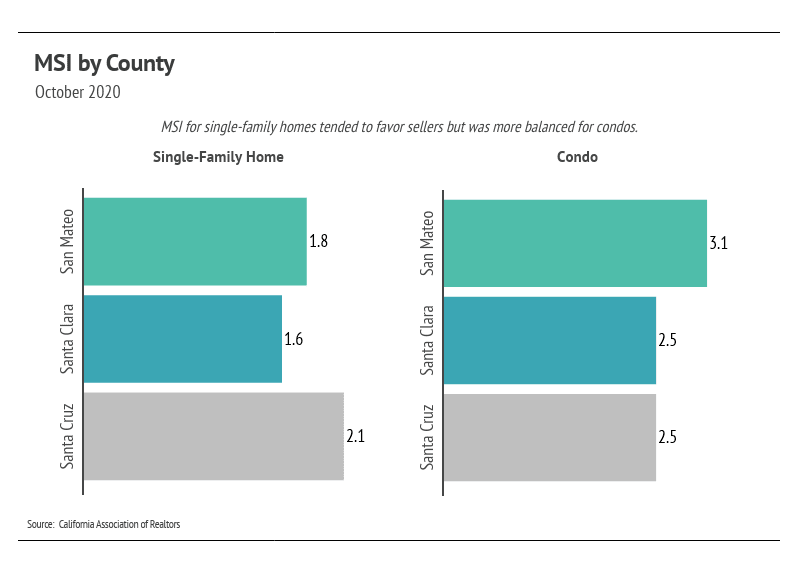
We can use MSI as a metric to judge whether the market favors buyers or sellers. The average MSI is three months in California (far lower than the national average of six months of supply), which indicates a balanced market. An MSI lower than three means that buyers dominate the market and there are relatively few sellers (i.e., it is a sellers’ market), while a higher MSI means there are more sellers than buyers (i.e., it is a buyers’ market). The MSI is one for single-family homes and 2.1 for condos, which means that both markets favor sellers.
In summary, the high demand in Silicon Valley has sustained home prices. Inventory for single-family homes will likely decline further as we enter the winter months, and fewer sellers will likely come to market, potentially lifting prices higher. At both the national and local levels, home builders simply cannot build quickly enough to bring sufficient supply to the market to satiate demand. Overall, the housing market has shown its resilience through the pandemic and remains one of the safest asset classes. The data show that housing has remained consistently strong through this period.
We anticipate new listings to slow through the holiday months. Condo prices will likely remain stable with no outsized gains or losses through the winter months. The autumn/winter season tends to see a slowdown in activity, although we may see a new trend this year with higher-than-normal sales.
As always, we remain committed to helping our clients achieve their current and future real estate goals. Our team of experienced professionals are happy to discuss the information we have shared in this newsletter. We welcome you to contact us with any questions about the current market or to request an evaluation of your home or condo.
Stay up to date on the latest real estate trends.




A Bay Area Realtor's approach to schools, neighborhoods, and long-term value for families making a move

You’ve got questions and we can’t wait to answer them.