Welcome everybody to our May episode of Bay Area Housing Market Town Hall.
The video version can be found on our YouTube Channel. Thank you for visiting us again. You are eager to know about the state of the market, and I know a lot of people are wondering where did the buyers go?
I took a screenshot of this from the MLS. We have not seen this in a while now. We always talk about how the properties will sell within a week. You usually see single-digit numbers on our MLS and then, it is gone. But all of a sudden, in the last 2-4 weeks, we have started seeing more double-digit numbers for homes that do not sell right after the first weekend of open houses, and we are wondering what happened and I am sure if you have gone to open houses in the last couple of weekends, you probably would have seen that it is not as busy as before. Of course, there are a lot of factors that are going into it
Let us take a look at the local market stats, the prices, inventory, sold/list ratios, days on the market, mortgage rate projections, and also, of course, Oscar is going to share with us the macroeconomics so that we can understand how that can affect our housing market as well.
Let us start with Santa Clara County.
In Santa Clara County, if we look at single-family residents, the closed sales were 1051, which had gone up 8.5% from just a month ago and the condo and townhomes number of closed sales was 556 units and it had gone up 6.5%
But compared to a year ago, we went down 16.1% and 2.5% for condos and townhomes.
The median sales price has gone up 1.6 from March and the April, median sales price has gone up to $1.95 million. As for condos and townhomes, it also broke the million-dollar mark a couple of months ago and now is at $1.04 million. So, have gone at 1.2%, but it went up double digits 18.2% from last year and 17% for condo and townhomes, and these numbers are tremendous. In a way, we did not expect that it is going to go up that much from just one year ago.
In terms of average days on the market, you will see that the average days on the market have been 10 days for both single-family and condo and townhomes. We are selling a lot faster compared to a year ago and again, I just want to remind everybody that this is the statistics as of April 30th, so it does not include the statistic from May yet.
You see that the sales/list price ratio, we topped around March of 2022 at about 15% over asking price. While last year, it was just still under 10% over asking price mostly until January 2022, also a shot up. Number of days on the market, of course, you see that it was used to be 14 days all the way to 18 days in December, but it dramatically dropped down to 10 days on the market on average in Santa Clara county, and this is based on 17,000 listings.
San Mateo County – Single-family residential median sales price are at $2.25 million and went up to a 9.2% compared to last month and it is 12 days just slightly more than March and also it has 445 units sold and went up 7.23% compared to March.
For condominiums and townhomes, the median sales price of $1.08 million, had gone up 15.7% from last month. I remember last month, the condo prices were lower than the Santa Clara County condo prices but then this one, it has shot above Santa Clara condominium and townhomes median sales price but the average days on the market is about 18 days on the market and there were 166 units sold, it is slightly less than March.
As for the sales/list price ratio, it is the same thing that we see – It had topped out over the March time frame, but it started to come down around April but is still well over 10% over asking price.
These are the numbers that I just pulled today. As of May 18th, we are seeing that it is still about 12.5% over asking price in May, but then in terms of number of days, it is about 14 days on the market.
Let us move towards Alameda County. You can see that the number of sales from June of 2021 down to April to 2022 has gone down quite a bit. This looks like it is a lot, but then we are only 18 days into May and we still have about 13 days more to go. It does look like it dropped quite a bit, but we will see it until the end of the month and see how much more it can increase, but it looks like the number of sales is probably going to be slightly lower than in April.
As for the median sales price, it has gone up from 1.495 to 1.53 for Alameda County.
For condominiums and townhomes, the same thing, we can see a pretty big drop in terms of the number of sales, but again, it is only 18 days’ worth of sales that we are looking at, but the price is still going up to $822,500 from $800,000 last month.
If we look at the sales/list price ratio in April of 2021, it had gone above 18% over asking price, that is a lot. It is more than Santa Clara and also more than San Mateo County. I know a lot of people if you are in Alameda County, you know how hot it is because there are so many movements going from the west of the peninsula area, the south bay area, and moving to the east bay area for bigger homes. Of course, it has come down a little bit, but we are talking about still 16% over asking price in May.
Contra Costa County – The median price slightly dropped down to $982,500 and in terms of the number of sales again that we topped out in March of 2022
But this side for condominiums and townhomes, the condominium pricing also dropped a little bit as of May, right now, it is $650,000. So it is interesting that we see Contra Costa, right now as of today, the median sales price has dropped compared to April, even though we do not have full pictures yet for May, but it is just so far, as of May 18, we do see a slight drop in the price.
In terms of their sales/list price ratio, April was the peak for them. It was 11% over asking price and so far as of May 18th, again, it has dropped down to slightly below 9% over asking price.

Now, let us look at the number of active listings versus the contingent pending listings for Santa Clara County and San Mateo County. These charts are pretty similar. What I want to show you is that even though I know this is a partial month, we are looking at a number of contingent and pending listings, meaning that looking at how many offers have been accepted during this time comparing the number of active. Again, even though this is partial, we see such a big gap over here. I feel even if we are going into the end of May, this gap is probably still going to be pretty high. Well, typically, we have seen that the pending is a lot more than the active for the past few months, but then over here, I do not know if we are going to be able to catch up to the number of active listings, meaning that we may have more active listings, more inventory on the market than people are writing offers right now.

Again, the same thing for Alameda County and Contra Costa County, but I think Contra Costa County probably will be able to catch up a little bit, but then this is a pretty big gap for Alameda County, so we are definitely seeing a lot fewer people on the market to purchase and making offers right now. As a matter of fact, I think just from our own team alone, a lot of our buyers are talking about pausing home buying for now because they are not sure about where the economy is going and then what does that mean though to the sellers. Because for the sellers who are putting their property on the market right now, they have to make some more educated decisions about whether they should withdraw the property or they should reduce their pricing or maybe they should wait until a few months later before they list.

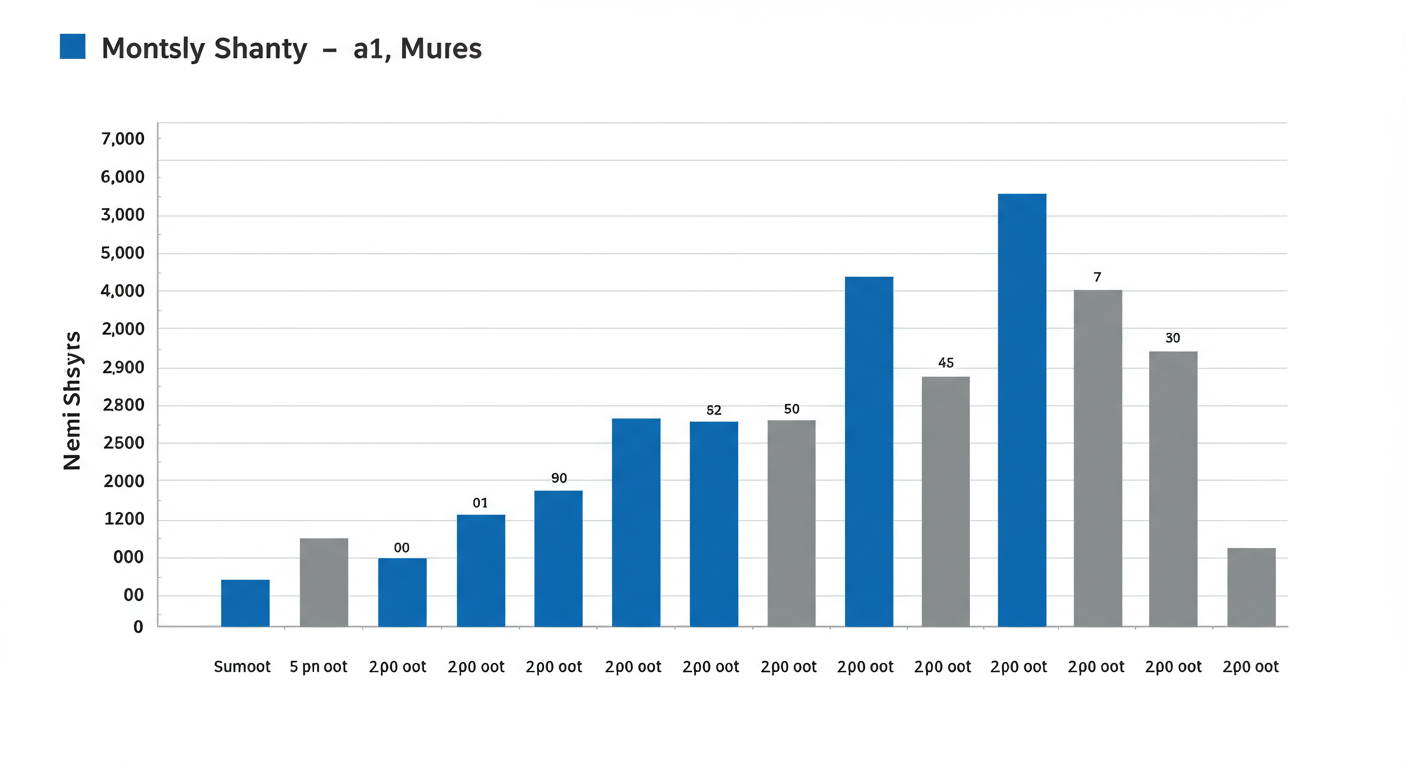
Let us take a look at what people have been doing, in Santa Clara County, San Mateo County, Alameda County, and Contra Costa county. We are looking at how many units or how many listings have a decrease in their list price. In January, there were very few of course, as the February, March, and April go, and also, we keep going to increase a lot more number of listings having their list price decrease during this time. This is only 18 days, from May 1st to May 18th, as you can see here, we already have a lot more compared to the whole month of April and this is across the board for all four counties. So just in 18 days, we have 210 listings that have dropped their price for Santa Clara County compared to 167 for the whole month of April and of course, way more compared to January and February.
The same thing for San Mateo County, we have 82 listings that have dropped their prices compared to a whole month of 73 in April and 204 listings in Alameda County compared to 158 a full month of April and then 246 listings in Contra Costa County compared to 224 listings in April.
The number of listings withdrawn – Some of the sellers might say, “I just want to withdraw right now” just because the market slowed down or maybe they do not have the offer. It does not mean that they are willing to sell lower. Some of the sellers might say, “I just want to withdraw and wait for the market to come back before we put it back on” or they just completely out of the market.
Here, again, in Santa Clara County, in 18 days, we see 144 listings have been withdrawn from the market compared to only 45 in January and then for San Mateo County, we have 61 listings compared to 39. You see in Santa Clara County, there is a lot more compared to San Mateo County even though in January, they are very similar in numbers.
As of Alameda County, we have 184 for the 18 days. It did not beat the whole 244 units in the entire month of April, but it is almost the same number for the entire month of March already. As for Contra Costa, we have 134 units versus 140 units for the full month of April.
This is something that you glean from these withdrawn listing. A tip well maybe to some buyers just to understand, maybe working with your realtors, is that some of the withdrawn listings do not mean that they are not selling anymore. They still want to sell. It might be worth it to look at these withdrawn listings. Ask your realtors to look for these withdrawn listings and approach the listing agents to see if they are willing to sell still or not.
The battleground for April is very different besides this part, San Leandro, has a asking for $599,000. Of course, everybody jumped on it. They had 35 offers that went up to $839,000. But everything else, you will see that there is only a single digit of a number of offers. We do not see these crazy 20 offers or 30 offers anymore and a lot of them has one offer.
It is in May that we see a transition period where we start saying “Oh, there is one offer, they still want to come in and bid for the property. They are still pretty aggressive, look at this one. They are still a $100,000 over the asking price.” But as of May, we are starting to see that buyers are trying to negotiate a lot more, starting to include more contingency on their offers.
May, I think, is the month when there is a major shift where there are some people still in this mindset that they need to get something in, and then, there is also another group of buyers who would like to wait and see.
Let us quickly go over the mortgage loan updates.
I want to share with you guys on February 2022 for High Balance Confirming 30-years Fixed, it was at 3.75% and then April also it jumped up to 4.875. I think that was the time when everybody was, “Oh! my God what just happened all of a sudden.” I might have a less loan amount being pre-approved for and then they have to get a new pre-approval letter. Some people said that it is not going to affect them too much. I will just put a little bit more down payment but May 2022 has gone up to 5.5% now. So, from February to April, it has gone a 1.125%, mortgage rate, and from April to May, it has gone another 0.625%, that is a total of 1.75%, in the mortgage rate. It is a shock to a lot of people, so many people are so used to seeing the 3s. Now, they are seeing 5s. This is also another reason why so many people, in May especially, back off, saying, “I do not want to buy right now. I am going to wait, see what will happen to the mortgage rates and also the economy.”

The Jumbo Loan – because Jumbo loan is so big here in the Bay Area. I want to go over the mortgage rate. The Jumbo Loan for 30-years Fixed was 3.375 back in February 2022 and in April, it was 4.125 and then in May 2022, it has gone up to 4.75.
Interestingly, for the jumbo loan, it did not go up as much. It went up 0.75% from February to April 2022 and then from April to May, it went up 0.625%, so a total of about 1.375% for Jumbo Loan.
What about all these agencies that we have been tracking, Freddie Mac, Fannie Mae Mortgage Bankers Association, National Association of Realtors?
You see this time, the whole chart is just red because every single agency has adjusted its projections.
Freddie Mac, they have gone up over 100 basis points on their projections since October and this is talking about they went from 3.7% for 2022 3Q, now they are projecting 4.8% and the 5% going forward from 2022 4Q all the way to 2023 2Q is going to be about 5%.
Then, Fannie Mae, it is 4.5% across the board, but they have gone up from February projections and have gone up about 60 to 70 basis points.
Mortgage Bankers Association also has gone up about 30 to 40 basis points since the projections in February.
National Association Realtors because last projections were in November 2021, it also has gone about 160 basis points for 3Q 2022 but then they are projecting that the mortgage rate is going to stay about 5.3% to 5.4% all the way to 2023 2Qs.
I thought this is interesting. Every single agency has gone up on its projections.
Thank you so much for reading our market update blog. This month, we also invited Oscar Wei, the Deputy Chief Economist at the California Association of Realtors to discuss Macroeconomic Trends and How They Affect The Housing Market. Check out the video
here!