Inflation Effect on Real Estate – August Bay Area Housing Market Updates

Welcome everybody to our 22nd episode of our Bay Area Housing Market Townhall. Today, we will talk about:
The video recording of this episode is available on our YouTube channel, click here to watch. Don’t forget to like the video and subscribe to our channel so you will get notified whenever we publish new videos!

First of all, let’s take a look at the Bay Area housing supply. We always see the number of sales usually goes up in July because of summertime. During the summer, sellers are more ready to put their property on the market, especially, you know, we’ve been talking about the low inventory. Also, we started to have vaccines, so sellers are more willing to come out and start selling their properties. As a result, we did see a little bit of an uptick of the active listings. However, compared to last year, the year before, and 2018, it is absolutely very low, it’s really nothing compared to what we used to have. So the inventory is still very low, and this is why you continue to see the prices going up.

In this chart, the yellow bars show the sales price to list price ratio. We saw that last year in August, it was a little over 100% over the asking price. It is obvious that we have some anomaly here in March 2021, but you still see the trend continues to go up despite the prices having gone up quite a bit. The number of sales did not come down either, it actually also continued to go up. With a very tight inventory, we actually have a lot of activities on the market. We actually have more sales compared to last year.

If we look at each county individually, here are the Santa Clara County housing stats. The average days on the market for single family has gone up slightly by just one day, but of course, still really low compared to last year. For the condo market, the days on the market are about 17 days versus 19 days last month and 35 days last year. If you look at the number of close sales, we actually have slightly less in Santa Clara County. It’s 7.2% less compared to a month ago, but compared to a year ago, we are still 22.2% more. This is talking about the close sale in July, meaning that these properties went under contract in June and closed in July. The same thing for condo and townhomes, they have less close sales compared to last month by 11.3%, but then compared to last year, it had increased by 58%. In terms of the pricing, prices came down a little bit by 4.6%, but compared to last year, it is still about 20% higher. The same thing for condo, it came down slightly compared to last month to $900,000, but had gone up 8.5% compared to last year.

In San Mateo County, we also saw that the price had come down a little bit in July compared to last month, it came down about 3.9%. Properties stayed on the market slightly longer – two days longer, and there were actually fewer sales for this month compared to last month. In terms of the condos and townhomes, the price also has dropped. It dropped by 3.7% to $922,000 and the average days on market is 24 days and also the close sales is 154 units compared to 187 units last month so it came down a little bit. If you remember a couple of episodes ago, we did talk about that the summer is when we will start noticing a slight slow down, the pricing will probably be a little bit more moderate, it’s not going to be as active, and we did start to see that for both San Mateo and Santa Clara County.

What about Alameda County? We’re seeing almost a similar trend that the pricing did come down a little bit to $1.146 million for East Bay in general.

While we look at days on the market, it stays almost the same with just a day longer. We did see a big huge drop starting from 26 days in January all the way down to 13 days now.

We usually compare the year before versus this year on the pricing, but this time instead of the year-over-year price change, I want to show you the comparison between last month and this month. As you see from June 2021 to this month, there are a few areas or cities that have dropped in prices. Alameda dropped down from $1.6 million to $1.332 million. Hayward dropped from $940,000 to $904,000. Newark went from $1.2 million to $1.18 million. San Lorenzo went from $875,000 to $850,000. Union City dropped from $1.4 million to $1.38 million. In Tri-Valley, Alamo had come down as well from $2.68 million to $2.5 million, but all the other cities actually have gone up a little bit.

Here in West Contra Costa County, we see that the prices in El Cerrito and Pinole have come down a little bit, as well as Concord, Martinez, Pleasant Hill, and Orinda have also come down in pricing.

What about our actual activities on the ground? Every month, we show you a little bit of what we’ve been doing and these are just some of the notable offers that we have made within our team. As you see, almost all of these if they are not multiple offers, there will be preemptive offers, and even some of them have multiple preemptive offers. Let’s look at the East Bay. These are all single-family in the Fremont area. Every single one of them had gone up quite a bit. There was one that sold $100,000 over the asking price, another one asking $2.8 million, got a cash offer and sold $425,000 over the asking price. In Milpitas, asking $1.425 million, they got five offers within three days, and went up to $1.687 million. We also have areas in San Jose – Silver Creek, Cambrian, Evergreen, Berryessa, and Campbell – they all received quite a few offers and way over asking price. In Sunnyvale, Cupertino, and Saratoga, these are areas with a higher price, and as you see that most of them have double-digit numbers of offers. They have gone way over their asking prices, especially the one in Cupertino that was sold almost a million dollars over asking price. So the market is still quite active, and these are most of the offers that we have made in just the last 30 days or so.

What about the mortgage loan situation? The organizations have adjusted their projections again, but good news is that they adjusted down. For 3Q 2021, Fannie Mae, Mortgage Bankers Association, and National Association Realtors believe that the mortgage rates are going to come down, and their adjustment is quite large – 30 basis points compared to what they predicted before. The average of all predictions has come down to about 3.1% for the 30-year fixed, while for 4Q 2021, the rate is gonna be about 3.3%, in 1Q 2022, it will be about 3.43%, and in 2Q 2022 about 3.58%. Only the Mortgage Bankers Association predicted that in 2Q 2022, the rate is going to go up a little bit more hitting 4.0%, but in general, all the agencies believe that the rate of the 30-year fixed is still gonna be quite a bit below 4%, although it is in the upward trend.
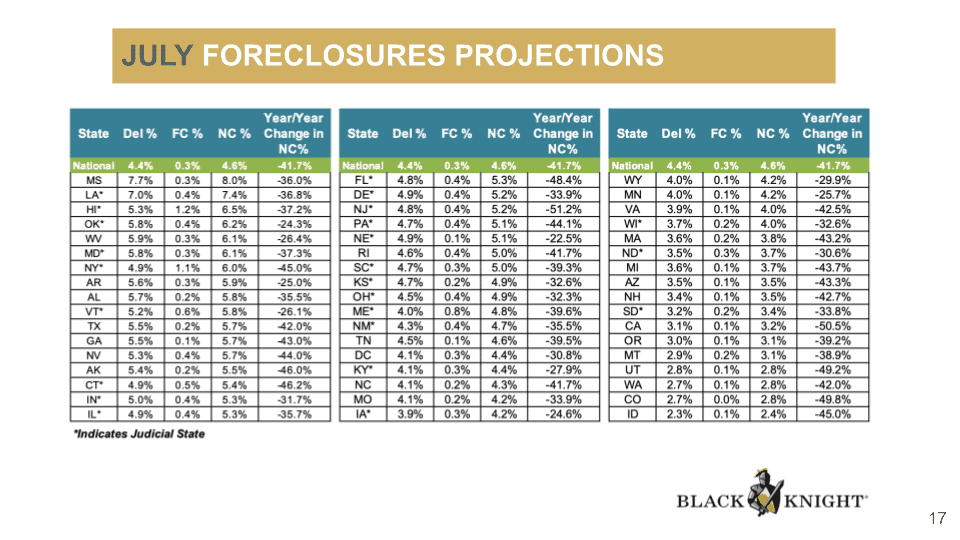
Now we are over a year and half into the Covid pandemic, and we’ve talked a lot about if the moratorium can cause foreclosures, there are still people talking about huge foreclosure waves coming. However, I still don’t see it from the statistics that I’m looking at and researching. As you see, for California, the delinquency percentage is 3.1% and foreclosure percentage is 0.1%, which makes the total non-current about 3.2%. As a matter of fact, it has reduced 50.5% year-over-year in the non-current loans, so I’m still really hopeful and we are doing really well compared to the rest of the country.

In terms of the national level, if you compare to 2008 when we had a total of over 4 million non-current mortgage loans, now as of June 30th 2021, we have come down to 2.465 million. We did have quite a high number of the non-current loans at about 3.3 million, but since then we have been down to 2.465 million.

What about inflation? Inflation news have been coming up, and just today, CNBC talked about “July consumer prices jumped 5.4%, but core inflation rises less than expected”. What does that mean? Before we go into this, we do need to understand what CPI stands for, and if it includes housing units. A lot of people think – of course, the housing price has gone up so much. However, the CPI views housing units as capital or investment goods, not as consumption items, so that’s actually not being calculated as part of the CPI. “Spending to purchase and improve houses and other housing units is investment and not consumption”. So I just want to make clear for everybody that when we look at CPI, we are not including anything that is relating to housing or real estate.

So we see that the CPI has been pretty low around 2% or even down to 1%, but then it just jumped and this is truly quite high compared to the values in the last two years.

According to Todd Horwitz from bubbatrade.com, he really believes that the government is the one who created this high inflation, because they have been providing stimulus packages allowing people not needing to go back to work. We actually have this oversupply of work and jobs, but not enough labor to come into work. CNBC also mentioned that “Employers who have struggled to find workers have hiked pay or offered signing bonuses to help fill the record 10.1 million job openings across the economy at the end of June… but instead of absorbing higher labor and material costs, some businesses have begun to pass on the impact of higher wages to their consumers”. This is really important to see that when we cannot find labor, when people don’t go back to work, the employers have to pay more money to hire these workers, at the end of the day, these employers or business owners have to pass these costs to someone else, and it will always end up going back to the consumers, which caused a lot of products rise their costs. He also mentioned that he does not believe the inflation has peaked, instead, it is going to continue to go up even more.

What does this translate to real estate? For California, we have a statewide rent control by AB1482, which states that “annual rent increase of 5% plus the annual CPI percentage change on all rental properties that are NOT exempt from AB1482. CPI percentage change should be based from April 1st of the prior year to April 1st of the current year for the region where the property is located”. So you do have to do some research, your property managers definitely can help you with that, but if you are in an area that does not have local rent control, then you are still part of the statewide rent control, then you need to know what the CPI is for your area, plus 5%, that’s the max you can increase on the rent. If we look at the San Francisco Area, you can probably use 3.8, but again, this is just a general Bay Area number. For example, if you are in Sunnyvale, then you’re going to look up the CPI of a city that’s the closest to Sunnyvale, which could be the San Jose area, so be sure to talk to your property manager to find out what the CPI number is for your area. If it’s 5% plus the 3.8%, then that means the max you can increase the rent would be about 8.8%. The CPI increase means that you can actually increase your rent more. As you see that in the past, it was 1.1% in 2020, so you could only increase the rent by 6.1%. So a higher CPI actually allows you to increase your rent a little bit more, especially if you’re purchasing a new property, and the rental income is really low, you can increase it a little bit more.

Now, let’s talk about the office market. I want to show you this through the Site Selection Magazine, which a lot of companies look at to determine which markets they should invest in. They actually look at a few criteria including workforce skills, workforce development, transportation infrastructure, ease of permitting and regulatory procedures, state and local tax scheme, right to work state, utilities, quality of life, incentives, and legal climate. Among the top 10 cities, there are Texas, North Carolina, South Carolina, Georgia, Tennessee, Ohio, and number 7 is California. Even though a lot of people have been complaining about California, and talk about the California exodus, California is still in the top ten. Then we have Utah and Virginia tied at number eight, and Arizona is number ten.

K.C. Conway, the Chief Economist for CCIM Institute and Director of Research for Alabama Center for Real Estate, shared some information regarding this as well about California. You see, actually in California, the business tax climate is ranked 49th, and as we all know that we are a pretty high tax state. In terms of higher education R&D expenditure, we are ranked number one, and we are also ranked first on the GDP Growth Rate Trend.

We know that a lot of companies still consider California one of the top 10 areas to invest in, but we do see that a lot of big tech companies postponed the return to work in the office. Twitter, Facebook, Google, as well as Asana and Lyft, they all have postponed and delayed their return dates, some to October for now, and some to February 2022. We definitely have to take a look further, hopefully, we can have the delta variant under control, I’m not confident we can contain it, but at the same time I think we do need everybody’s cooperation to help, so that these companies can allow a lot of their employees to go back to work if they want to.

Now, the rental housing market. Surprisingly, not just the sales market has been really hot, actually it’s been on the news that “demand for home rentals rockets as tenants get into bidding wars”. Zumper said that one bedroom apartments have increased 7% year over year in July, compared to 2020, July 2021 has increased 7%. Two-bedroom increased 8.7%, and single-family rentals had increased by 6.6%.

They said that “Americans who lost their jobs because of the pandemic rushed to find cheaper housing, pushing rents higher for the least expensive apartments and homes in the suburbs”. So we’ve been talking about the suburbs, where the market did not crash like the metropolitan areas like San Francisco, New York, Oakland, and San Jose Areas during the pandemic, especially in 2020. They have been holding their rent pretty well.

Let’s take a look at a few of these cities. Look at San Francisco, it did drop 15% year over year, and still dropped 2.5% compared to last month. However, there are a few areas that have recovered quite well. Emeryville has come back 5% month over month, Santa Clara as well 5%, Sunnyvale came up 5%. These are the top three that have come up for one bedroom apartments. In terms of the two bedrooms, Menlo Park increased by 5.1% from last month, but Berkeley still went down 3.3%. So we do have some areas that are doing pretty well, and some areas still trying to catch up. I think most of these cities are going in the right direction right now.
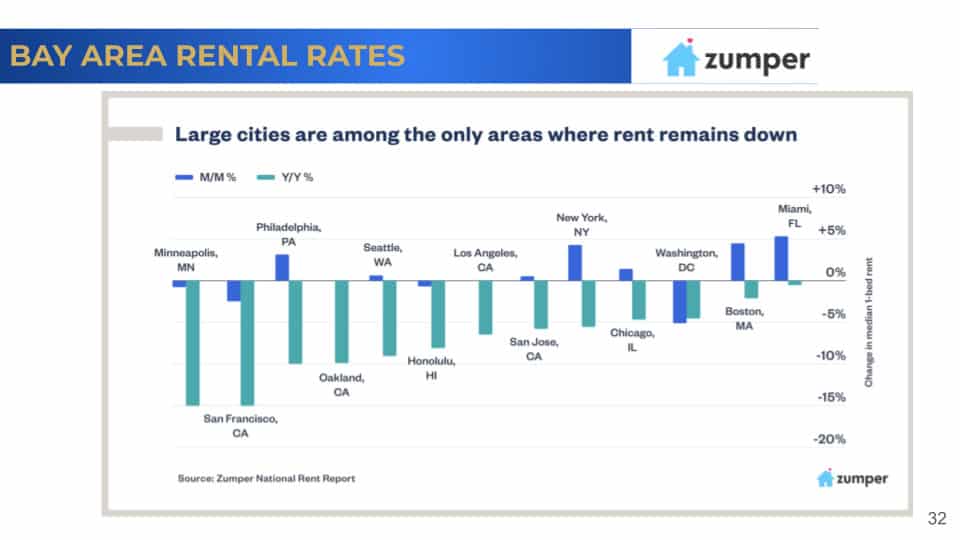
Here is a chart comparing other large cities in the country. As you see that San Francisco and Minneapolis are both still down year over year and even month over month. But if we look at Oakland, it’s break even, and the same thing for Los Angeles. San Jose has gone up, so it actually is leading among all the other metropolitan areas in the Bay Area right now.

We talked a lot about people moving out of the Bay Area, and this is an interesting chart – “there has been a mass exodus of renters out of the Bay Area in 2020, but there has also been a growing interest in new renters moving in to replace them”. We keep hearing the news talking about people moving out, but they don’t talk about people moving in as well. This is a good chart to show that, yes, we have quite a bit of people moving out, but we also have quite a bit of people coming in. One of the reasons is probably that the rent had gone down so much for those people who always wanted to live in the Bay Area, maybe San Francisco, now they feel like they have a chance to actually try to live here. So this is quite an interesting chart to keep everybody a little bit more optimistic, it’s not like everyone is really moving out of California. As a matter of fact, I just came back from Chicago for a conference where I met with a lot of commercial real estate professionals around the country. Everybody was asking – how are you guys doing? I heard that people are really moving out of California, and how’s your market? I kept saying – our market’s doing really well. They asked if people were still buying, and I said, yes, people were still buying, there are still a lot of people in California. I do feel that the news is kind of bloated out of proportion talking about so many people have left. I do agree that there are people who left, and I know personally a lot of people left as well, but at the same time, there are still a lot of activities within our area.

In terms of rent payment tracker, we show this every month. We are still in a relatively healthy state. We still have collected about 95% full month for the month of July.

A lot of property managers use Yardi to do their property management reports, and it’s interesting on their national multi-family report that came out in July. It says “gateway metros are recovering quickly with substantial month over month rent gains. San Jose (3.6%) leads, followed by Boston (3.2%), New York (3%), Miami (2.7%), San Francisco (1.8%), Chicago, Washington, D.C. (both 1.5%), and Los Angeles (1.2%)”. Of course, when I saw this I was very excited, because I really do feel it on the ground. When they call San Jose, it’s more like a Silicon Valley area, it really did improve quite a bit.

Here it says that “Multi-family and real estate in general has always served as a hedge against inflation. Asking rents for multifamily are rising at their fastest rate in decades,while the single-family rental market is experiencing the same rapid price appreciation. The surge in rents does not seem likely to fade anytime soon as there is significant under supply of multi-family housing in most metros, creating robust demands”. Here is month over month range growth on all asset classes, and I only highlighted the ones in California. San Jose is about 3.6% as we mentioned, and Sacramento is over 2%, San Francisco slightly less than 2%, and Los Angeles is like 1%. We are still seeing the month over month rent growth.

Now, my conclusion is that the housing prices are still increasing, but we do see a bit of a cool down in the summer, because a lot of people have gone on vacation with still a little uptick on the supply in July. Because what we saw is actually back in the June time frame, and we recorded it in July, so next month I think we’re going to see even more uptick in the supply. The interest rate is still really low, it’s still decreasing compared to last year. However, we’re going to start seeing it go up very slowly. Unfortunately, inflation has not peaked, meaning a lot of our consumer products are probably gonna get more and more expensive. That’s why the best hedge is to own real estate, and I’ll explain a little bit more why that is. In terms of the commercial real estate market, the California market is still considered an ideal place to invest. It is still a top 10 place to do business. Also, the rental rates are recovering across the country, and the San Jose region leads the recovery in the Bay Area.

I mentioned that with inflation, the best hedge is to own real estate. If there is inflation, the rent would increase as well. For five plus units, the property value calculation is based on net operating income over cap rate, so if I’m just going to give you a very simple example. Imagine if we are buying in the Bay Area, and you own 10 units versus owning 10 units in a suburb area. You increase rent per unit by about $100, so your total annual rent increase is $12,000 for both properties. Now, the only difference is that in the Bay Area, the cap rate usually is slower. Let’s say it’s about 2% lower than the suburb area. By using this same formula assuming everything else stay constant, assuming your expenses are the same, you just increased your net operating income by $12,000. Then in the Bay Area, using this formula, your property value increase will be $300,000 versus the suburb, it increases by $200,000. Now, if your rent increase is more, then you’ll see this significant difference. Instead, if you increase your rent like by $300 per unit, with 2% difference on the cap rate, you increase your property value by $300,000 more compared to buying a property in the suburb. I absolutely love buying properties in suburb areas, because they’re just more opportunities, and it’s more affordable to purchase. I just want to show you why there are still so many investors buying in the Bay Area despite such a low cap rate. It is because of the power of cap rate, and how it can increase your property value. If inflation causes your rent to increase fast, then your profit value is going to increase even faster. This is why real estate is such a good way to hedge inflation.
This month, we also invited attorney Sarah Kern to discuss how you can hold titles to best protect yourself as a homeowner, landlord, or active investor. Watch the webinar recording here! As always, please don’t hesitate to get in touch with us if you have any questions, comments, or other topics you would like to discuss.
Stay up to date on the latest real estate trends.
A Bay Area Realtor's approach to schools, neighborhoods, and long-term value for families making a move


Part 1 of HAYLEN's series on the 2026 CCIM Spring Forum in Philadelphia
You’ve got questions and we can’t wait to answer them.