March 2021 Newsletter – Housing Market Updates for the Greater Bay Area

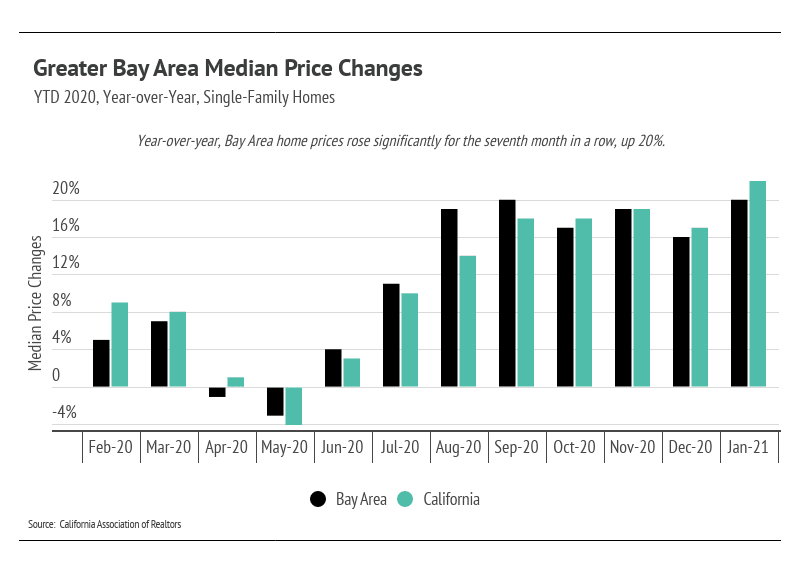
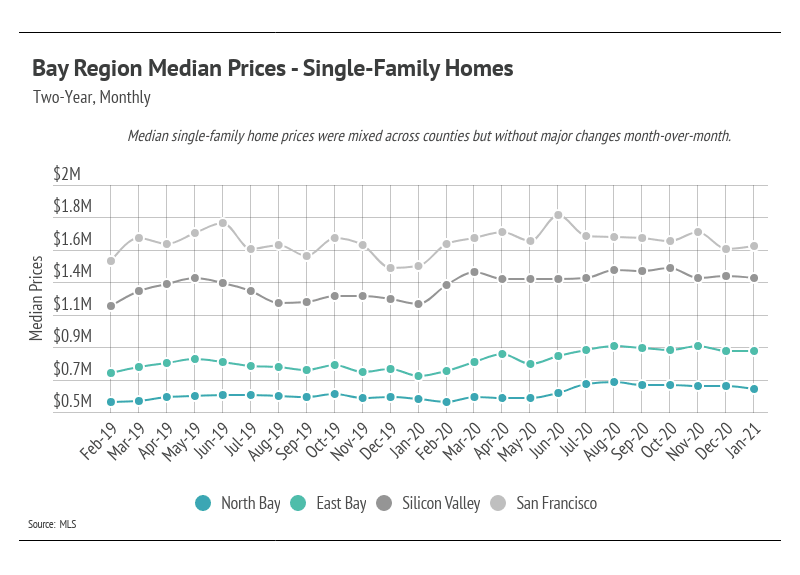
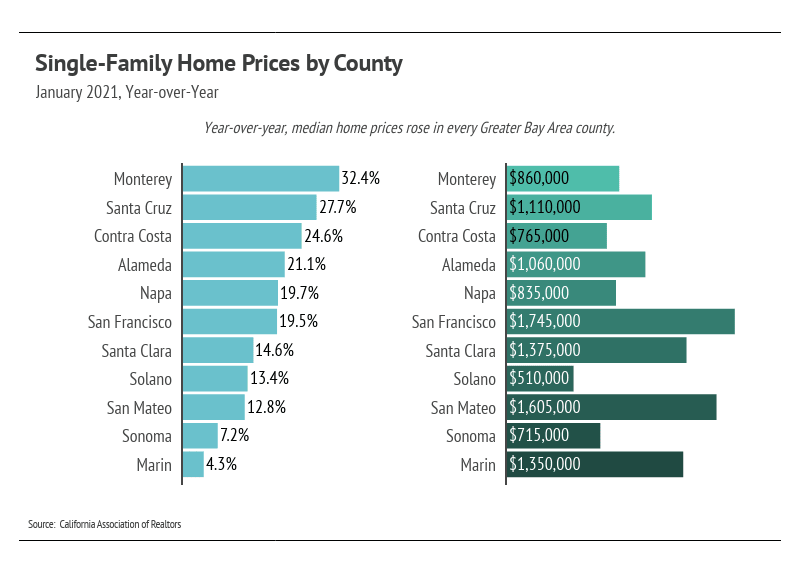
The median single-family home price fell slightly in January 2021; however, year-over-year, single-family homes prices in the Bay Area increased considerably, up 20%.

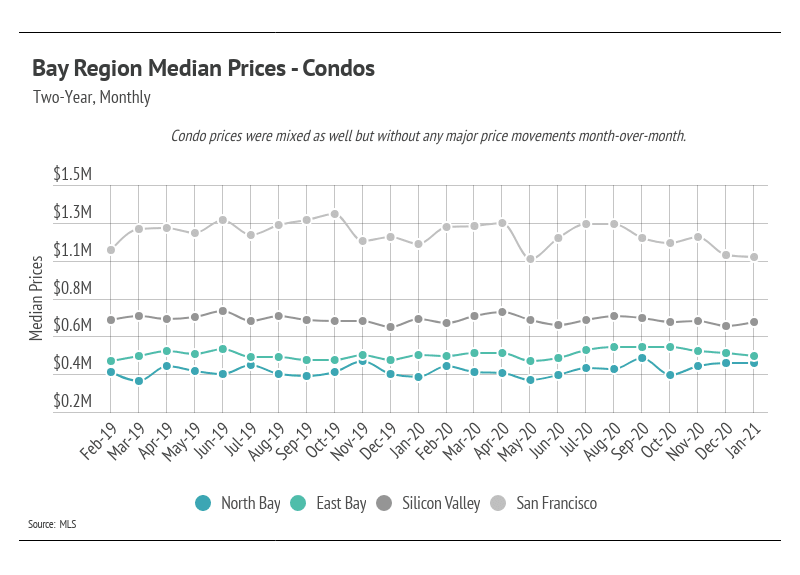
As you can see in the graph below, median condo prices by region were fairly flat over the course of 2020, without large price gains or losses. January 2021 showed a continuation of this trend without any large price movements in any region.
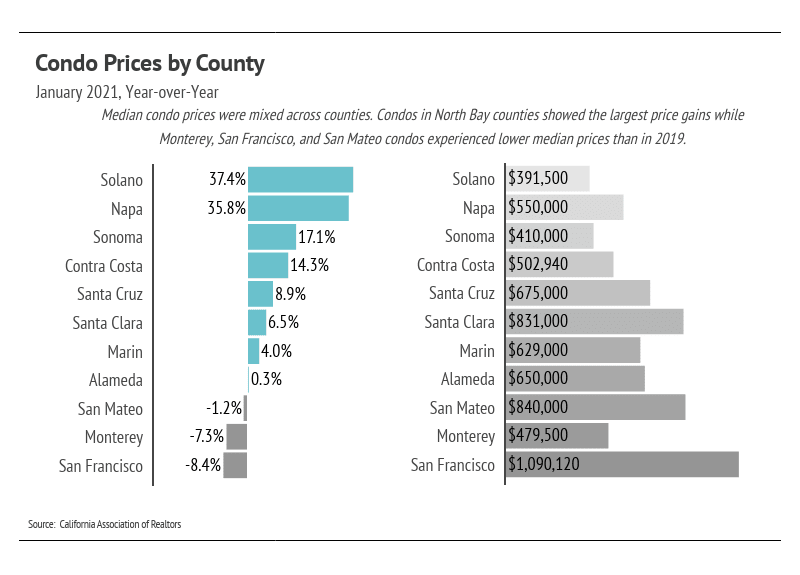
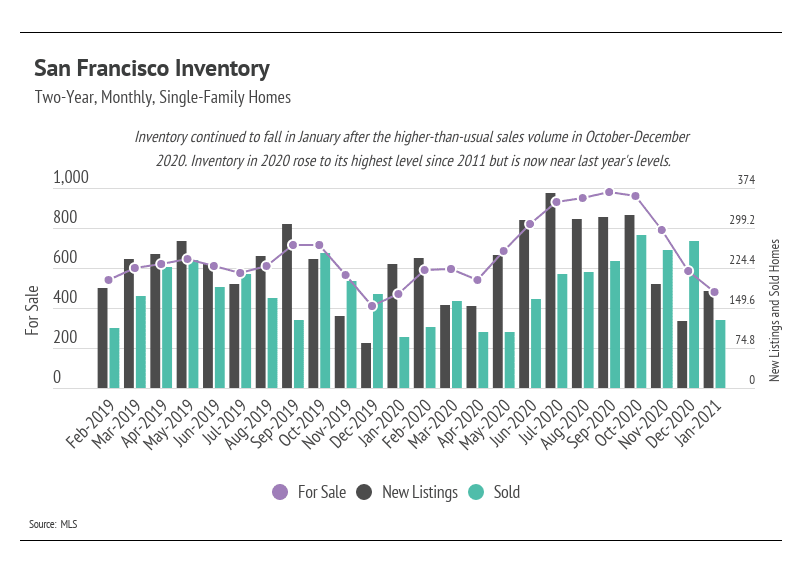
Single-family home inventory remained lower through 2020 relative to 2019 with the exception of San Francisco, which speaks to the desirability of the Bay Area. During the pandemic, fewer people wanted to leave, and more people wanted to move to the area. New listings throughout the year were lower than normal, while sales were much higher. By the end of 2020, sales remained steady as new listings declined. In January 2021, inventory continued to decline in every region of the Greater Bay Area. With such a consistent level of demand, prices will likely continue to appreciate throughout 2021.
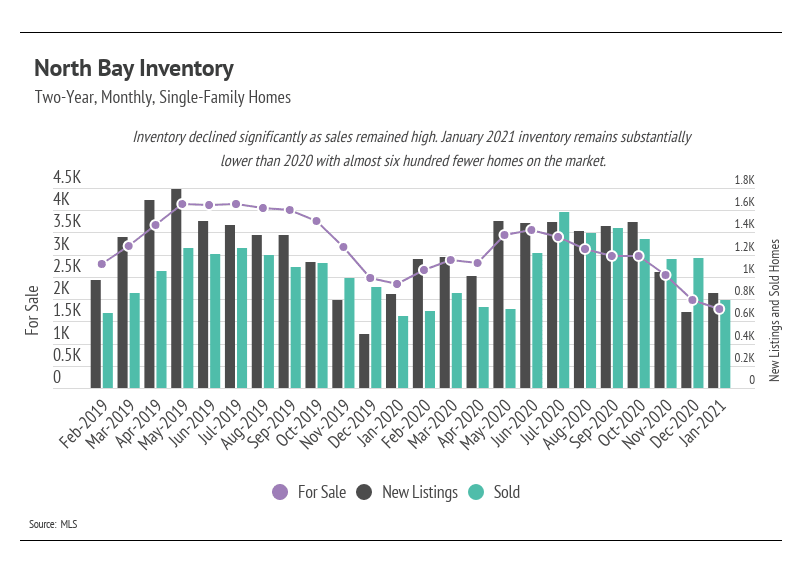
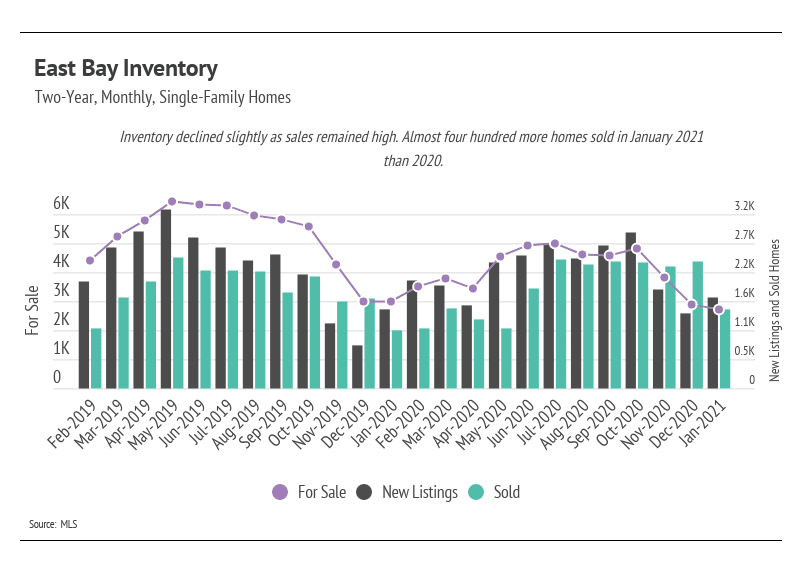
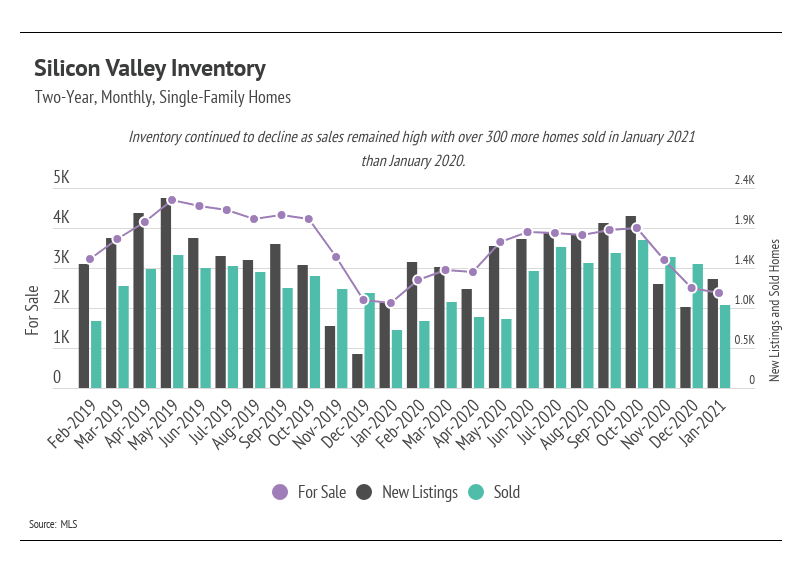
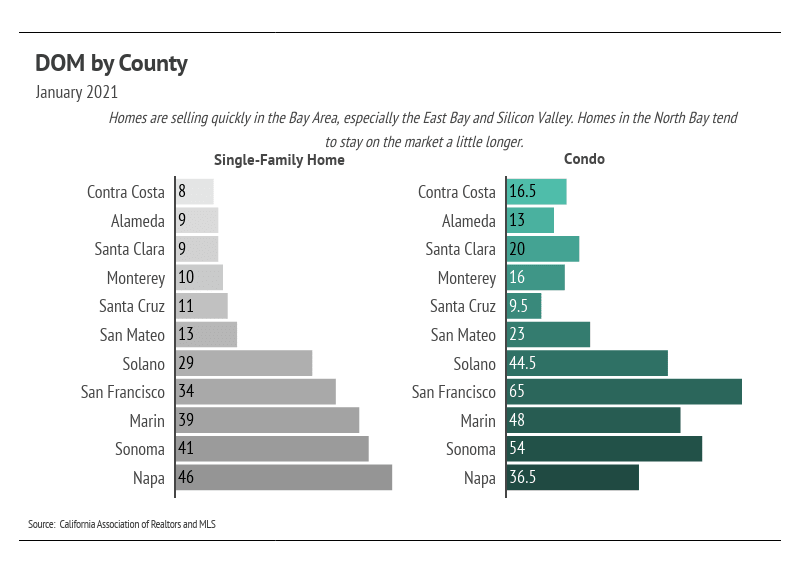
Days on Market (DOM) declined further for single-family homes throughout 2020 and now into 2021, spending far less time on the market than last year. As we will see, the pace of sales has contributed to the low MSI over the past several months.

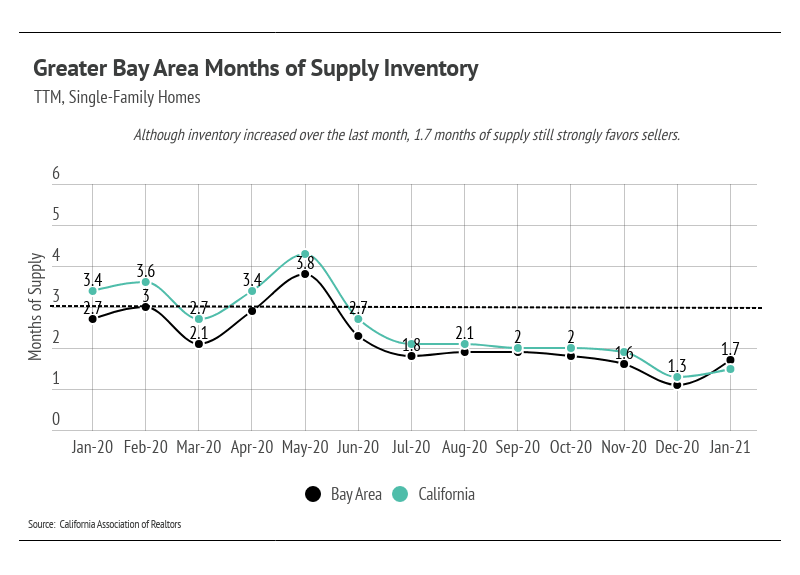
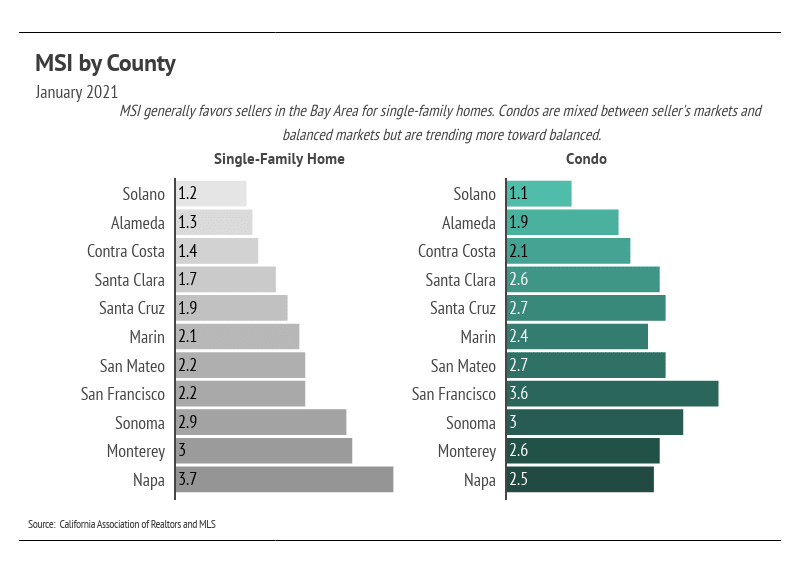
We can use MSI as a metric to judge whether the market favors buyers or sellers. The average MSI is three months in California (far lower than the national average of six months), which indicates a balanced market. An MSI lower than three means that there are more buyers than sellers on the market (i.e., it is a sellers’ market), while a higher MSI means there are more sellers than buyers (i.e., it is a buyers’ market). In January 2021, the MSI remained below two months of supply for both single-family homes, favoring sellers.
In summary, the high demand and low supply present in the Greater Bay Area has buoyed home prices. Inventory for single-family homes and condos will likely decline further this year, and fewer sellers will likely come to market, which will potentially lift prices higher. Overall, the housing market has shown its resilience through the pandemic and remains one of the most valuable asset classes. The data show that housing has remained consistently strong through this period.
We anticipate new listings to slow until around March 2021. While the winter season tends to see a slowdown in activity, January 2021 showed higher-than-normal sales, once again highlighting the desirability of the Greater Bay Area.
As always, we remain committed to helping our clients achieve their current and future real estate goals. Our team of experienced professionals are happy to discuss the information we’ve shared in this newsletter. We welcome you to contact us with any questions about the current market or to request an evaluation of your home or condo.
Stay up to date on the latest real estate trends.




A Bay Area Realtor's approach to schools, neighborhoods, and long-term value for families making a move

You’ve got questions and we can’t wait to answer them.