November Newsletter – Greater Bay Area Local Lowdown

Quick Take:
Note: You can find the charts/graphs for the Local Lowdown at the end of this section.
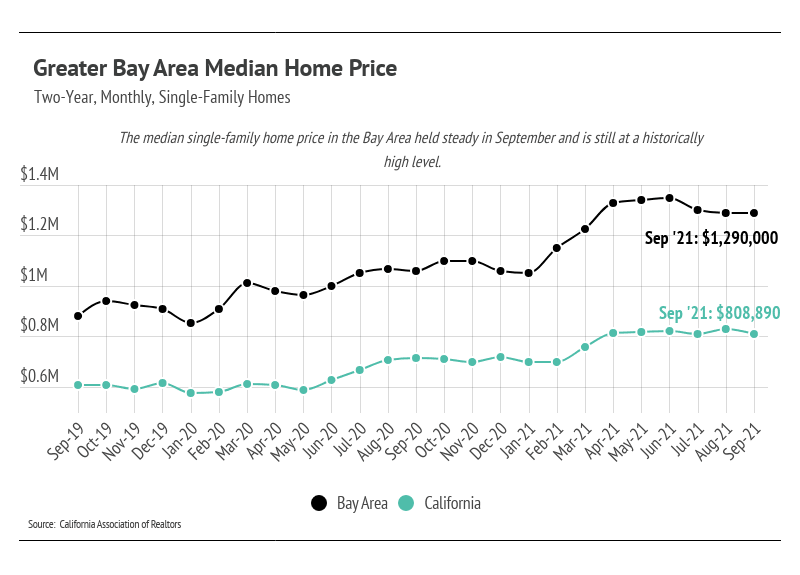
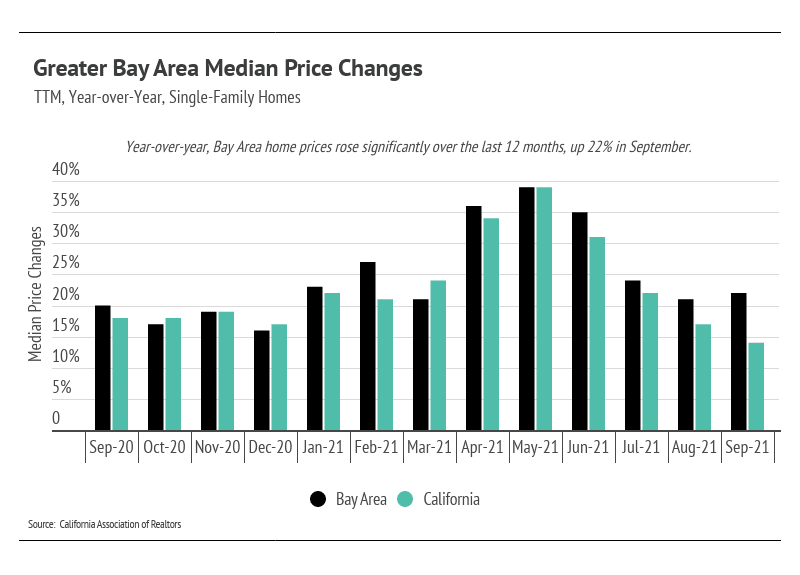
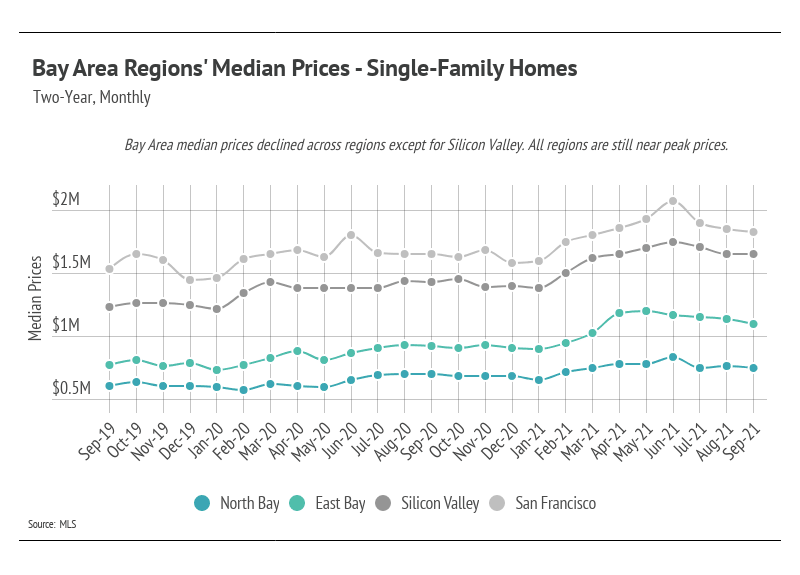
The growth rates in 2021 are highly unusual and unsustainable for most Greater Bay Area regions; for example, home prices would more than double every five years at a 15% growth rate. After huge single-family home price appreciation in the first half of the year, it made sense that prices pulled back in the third quarter. During the summer months (July–September), home prices declined in all regions, but remained historically high.
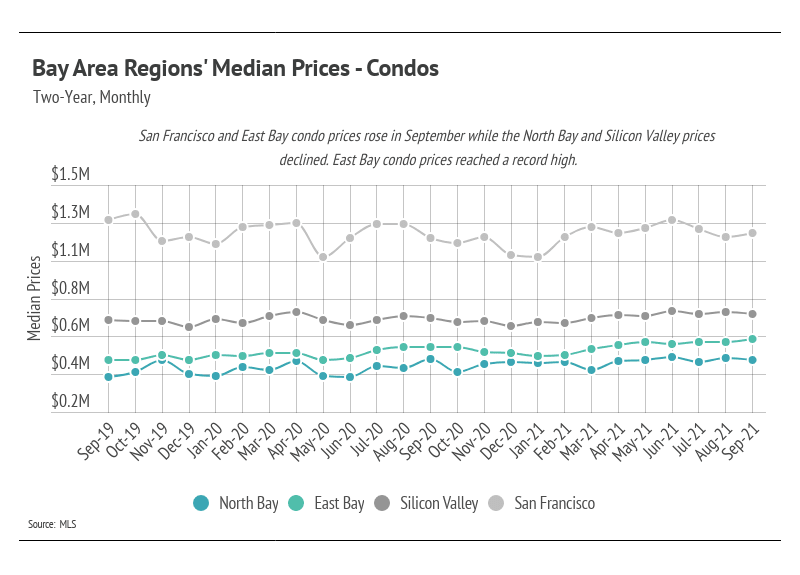
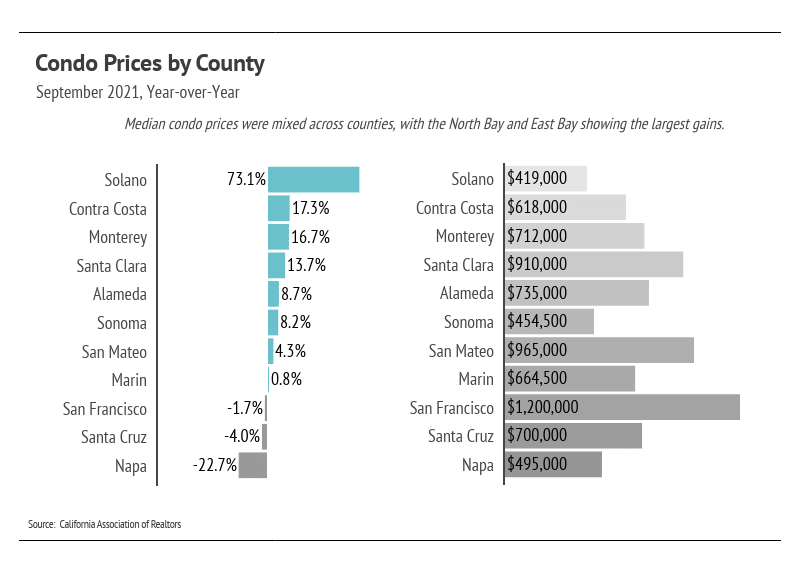
Condo prices declined less significantly in the third quarter with the exception of the East Bay, which continued to rise in the third quarter, reaching a new all-time high. Although the price appreciation wasn’t as pronounced for condos as it was for single-family homes, the growth rates for condos in 2021 are also unsustainable. We expect price appreciation to slow going into the winter months, a seasonal norm.
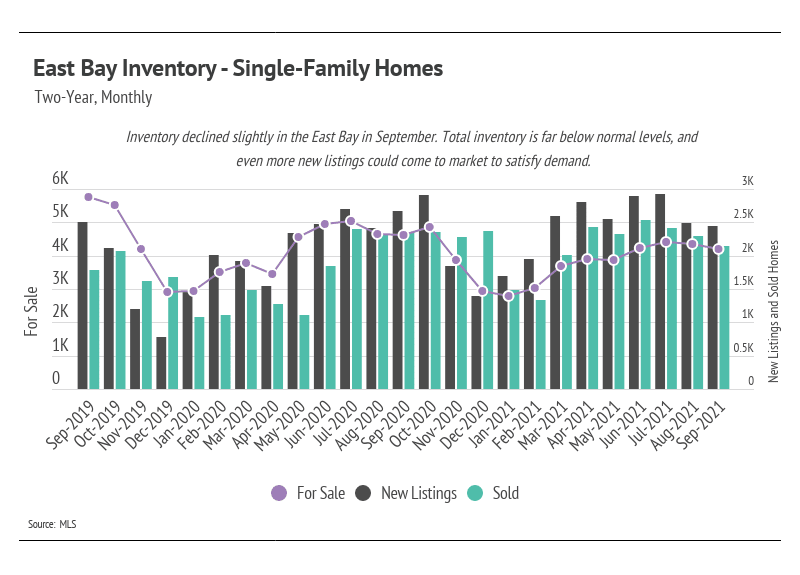
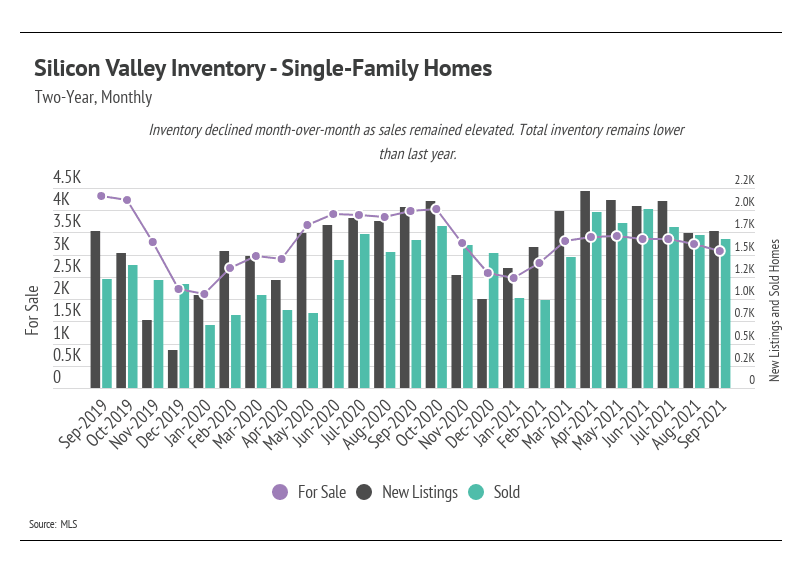
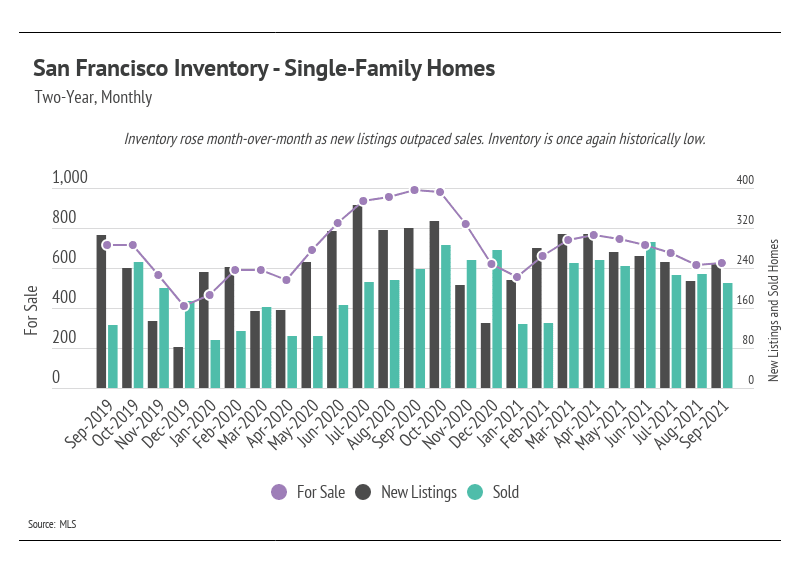
Despite the increase in single-family home inventory in 2021, we’re still at a historic low. August and September are typically the months with the highest inventory every year. In 2021, total inventory didn’t come close to last year’s level and was even further away from pre-pandemic levels. Even though we’re seeing some price correction after the first half of the year, the sustained low inventory will lift prices. Sales in the Greater Bay Area have been incredibly high, again highlighting demand in the area.
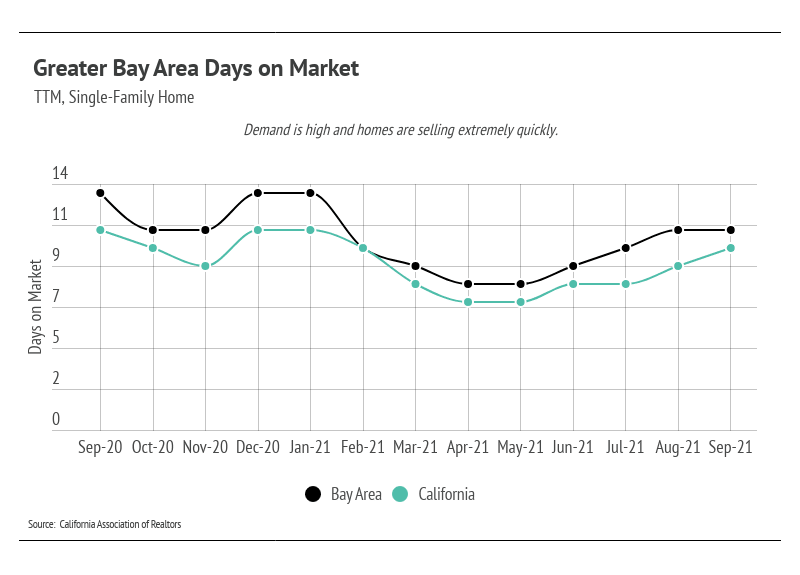
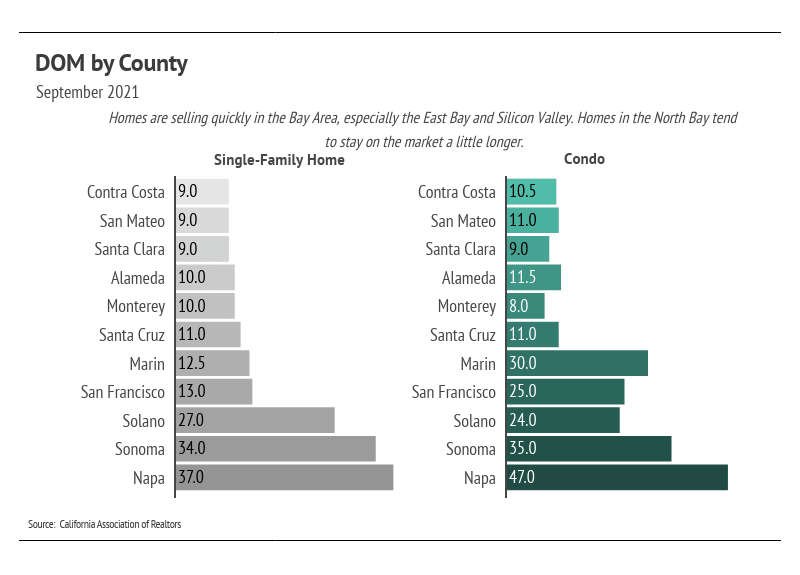
Homes are selling faster than at any point in the last 15 years. The Days on Market reflects the high demand for homes in the Greater Bay Area. Buyers must put in competitive offers, which, on average, are above the list price of the home.
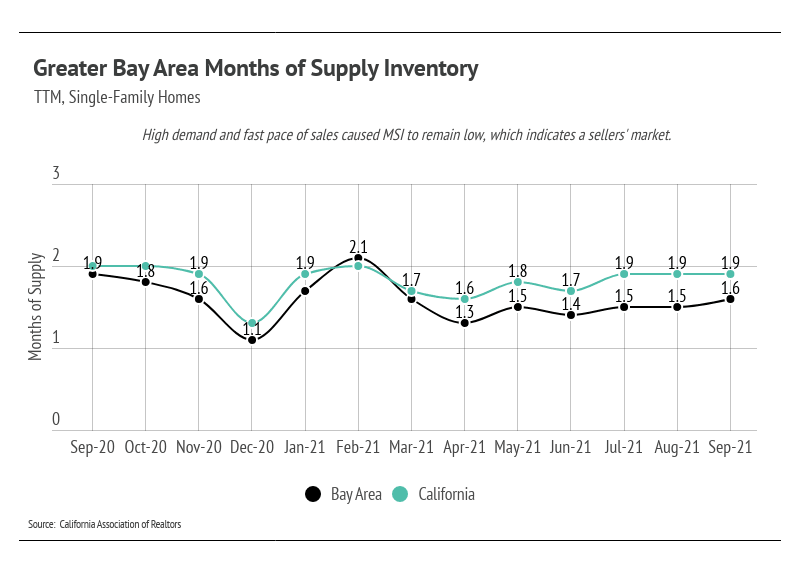
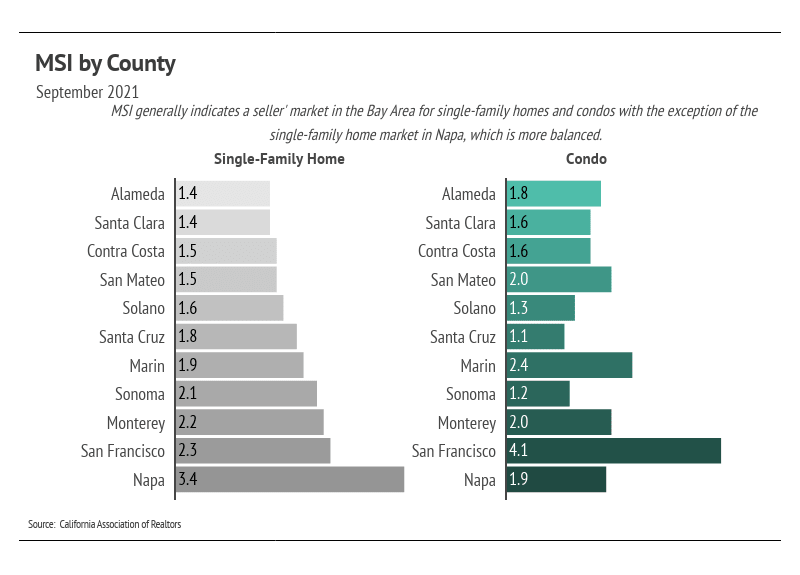
Months of Supply Inventory (MSI) quantifies the supply/demand relationship by measuring how many months it would take for all current homes for sale on the market to sell at the current rate of sales. The average MSI is three months in California, which indicates a balanced market. An MSI lower than three indicates that there are more buyers than sellers on the market (meaning it’s a sellers’ market), while a higher MSI indicates there are more sellers than buyers (meaning it’s a buyers’ market). MSI in the Greater Bay Area is historically low for single-family homes and condos, indicating a sellers’ market.

Our team is committed to continuing to serve all your real estate needs while incorporating safety protocol to protect all of our loved ones.
In addition, as your local real estate experts, we feel it’s our duty to give you, our valued client, all the information you need to better understand our local real estate market. Whether you’re buying or selling, we want to make sure you have the best, most pertinent information, so we put together this monthly analysis breaking down specifics about the market.
As we all navigate this together, please don’t hesitate to reach out to us with any questions or concerns. We’re here to support you.
Stay up to date on the latest real estate trends.


And what to check before upgrading your internet plan


HAYLEN, an Asian-owned, people-first real estate firm, selected to steward real estate process for J-Sei Home’s next chapter


You’ve got questions and we can’t wait to answer them.