November Newsletter – Key Topics and Trends

Quick Take:
Note: You can find the charts/graphs for the Big Story at the end of this section.
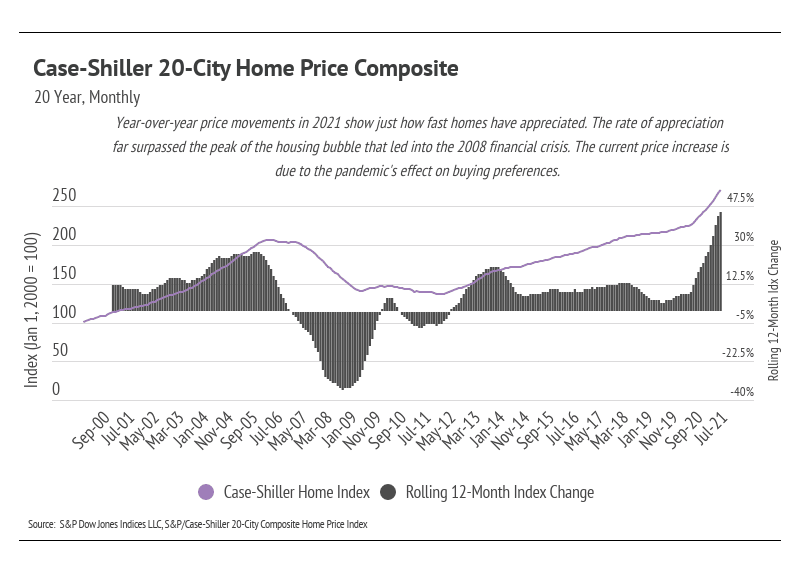
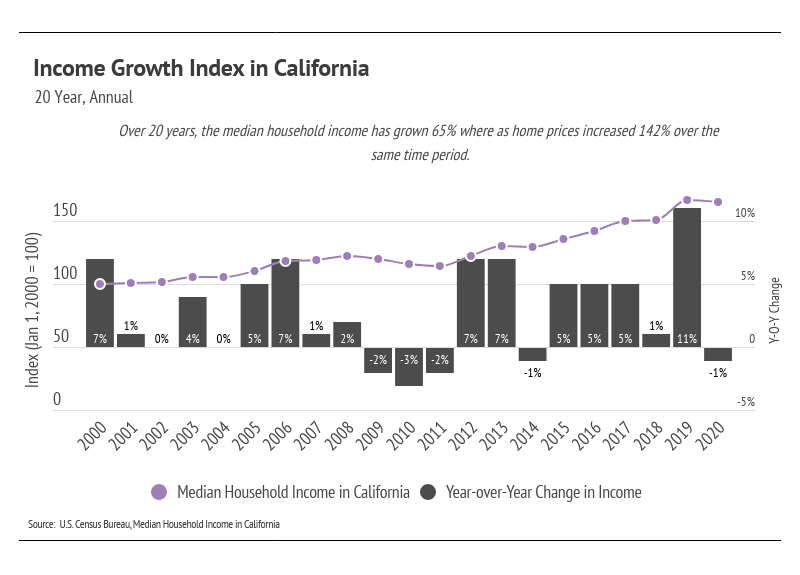
Income is one of the largest predictors of home price growth, second only to available supply. Consumers have more money to spend, which in turn drives up prices. But the increases in income haven’t kept up with the rise in home prices, especially in the last two years. In 2020, home prices increased 10% according to the Case-Schiller 20-City Composite Index, while median income decreased by 1%.
The disconnect between income and home prices is happening for two reasons. First, the ability to take on debt means that income doesn’t necessarily need to increase at a 1:1 ratio with home prices. Second, the pandemic changed buyer preferences, increasing the demand for homes and dropping inventory to previously unseen lows.
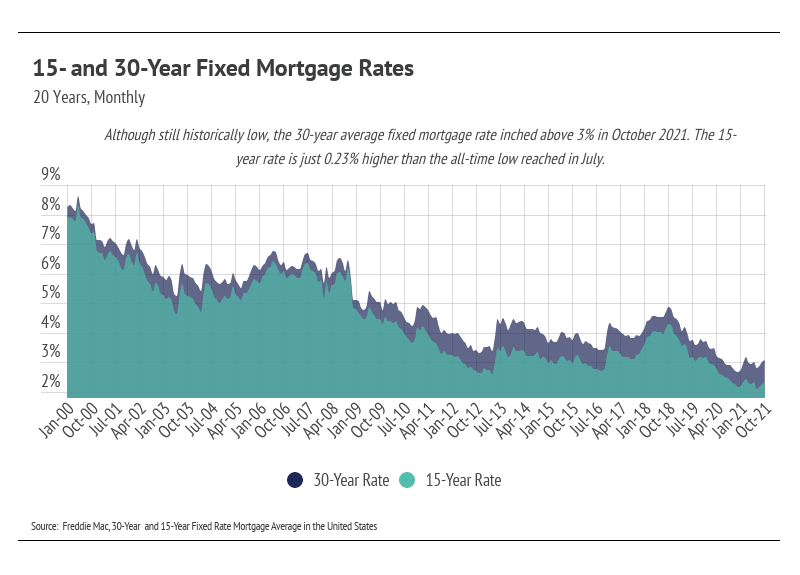
Because home price increases outpaced income growth, homebuyers needed to take on more debt to buy a home than they would have a few years ago. But due to the drop in interest rates, the monthly payment, even on a higher-priced home, becomes more affordable. For every 1% decrease in a 30-year mortgage rate, the price of the home can increase 13% without a change in monthly payment (and vice versa). For example, the monthly payment on a $1,000,000 mortgage at 4% is almost identical to the monthly payment for a $1,130,000 mortgage at 3%, a $130,000 difference.
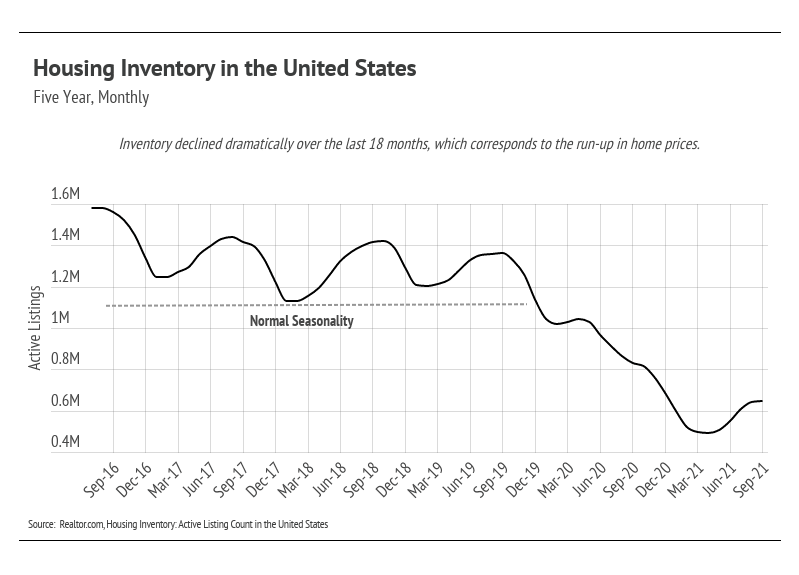
The pandemic also changed buyer preferences. Rather than spending roughly half of our time at home, which is the norm, we were faced with endless time in our living spaces. (You remember — you were there.) As of September 2021, the United States has 59% fewer homes on the market, and 53% of that happened in the last two years. We were happy to see more homes on the market in the second quarter of 2021 because the increased supply helped satiate the high buyer demand, but we are already seeing the seasonal shift to fewer homes coming to market. Inventory will likely remain super low in the coming fall and winter months.
The market remains competitive for buyers, but conditions are making it an exceptional time for homeowners to sell. Low inventory means sellers will receive multiple offers with fewer concessions. With so many moving parts in real estate transactions, working with an experienced real estate agent is essential in smoothly navigating the entire buying and selling process.
Our team is committed to continuing to serve all your real estate needs while incorporating safety protocol to protect all of our loved ones.
In addition, as your local real estate experts, we feel it’s our duty to give you, our valued client, all the information you need to better understand our local real estate market. Whether you’re buying or selling, we want to make sure you have the best, most pertinent information, so we put together this monthly analysis breaking down specifics about the market.
As we all navigate this together, please don’t hesitate to reach out to us with any questions or concerns. We’re here to support you.
Stay up to date on the latest real estate trends.


And what to check before upgrading your internet plan


HAYLEN, an Asian-owned, people-first real estate firm, selected to steward real estate process for J-Sei Home’s next chapter


You’ve got questions and we can’t wait to answer them.