October 2022 Newsletter - Greater Bay Area Local Lowdown

October 2022 Newsletter - Greater Bay Area Local Lowdown

Quick Take:

  • The Bay Area’s housing market is cooling after a huge appreciation over the past two years.
  • Sales and new listings are on the decline, which will reduce inventory as we head into winter.
  • Months of Supply Inventory indicates that the market is trending toward more balance between buyers and sellers.
Note: You can find the charts/graphs for the Local Lowdown at the end of this section.
 

Price contraction after explosive growth is normal

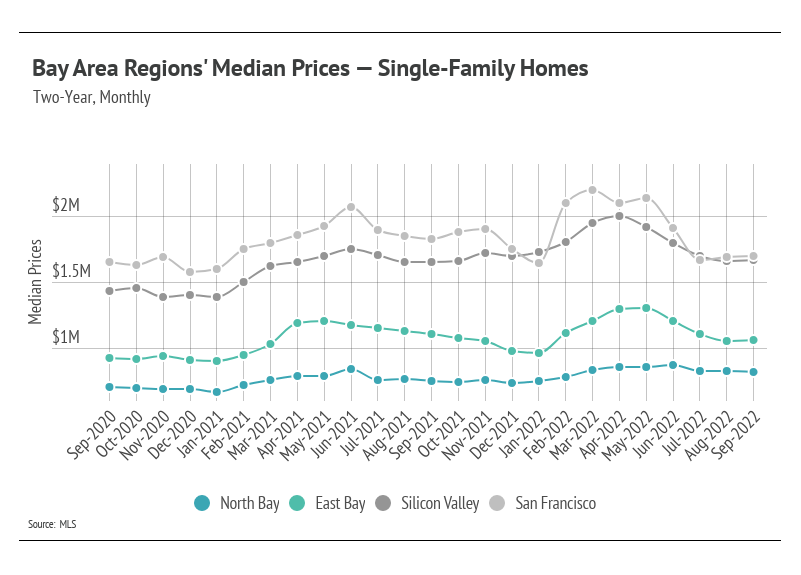
When we consider the increases in mortgage rates and normal seasonal trends this time of year, when prices tend to stagnate or decline slightly, the price contractions that single-family homes experienced in the second half of this year aren’t alarming. Yes, we are moving into a new chapter in the housing market that doesn’t involve astronomical price increases and 20 offers the first day the home gets listed, but that’s actually a good thing. Home prices in the Bay Area grew quickly, and a contraction is a normal response to that sort of growth. We are now entering a stage of slower growth — but still growth. Real estate has shown itself to be one of the best investments in recent history and is, on average, the largest store of wealth for an individual or family. Price appreciation will likely move to a more normal growth rate of around 5-6% in the coming years.
 

Fall sales slowdown

Single-family home and condo sales declined month-over-month, along with fewer new listings coming to market. This caused inventory to decline across the Bay Area, a trend that will likely continue through the rest of the year. The Bay Area, along with the rest of the country, has not returned to pre-pandemic inventory levels. Homes have generally sold faster over the past two years, making new listings more and more important to the market. Inventory generally grows when new listings increase or homes sit on the market. With rates rising at such a rapid pace, new listings are slowing considerably. We can tie new listings not only to supply, but to demand as well, because sellers are often buying, too. Softening demand has brought the market closer to balance despite low inventory.
 

Months of Supply Inventory implies a sellers’ market

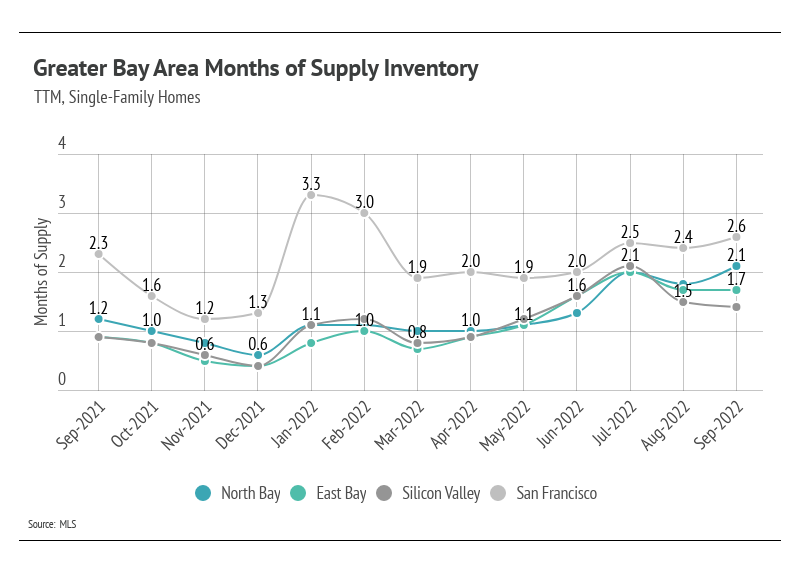
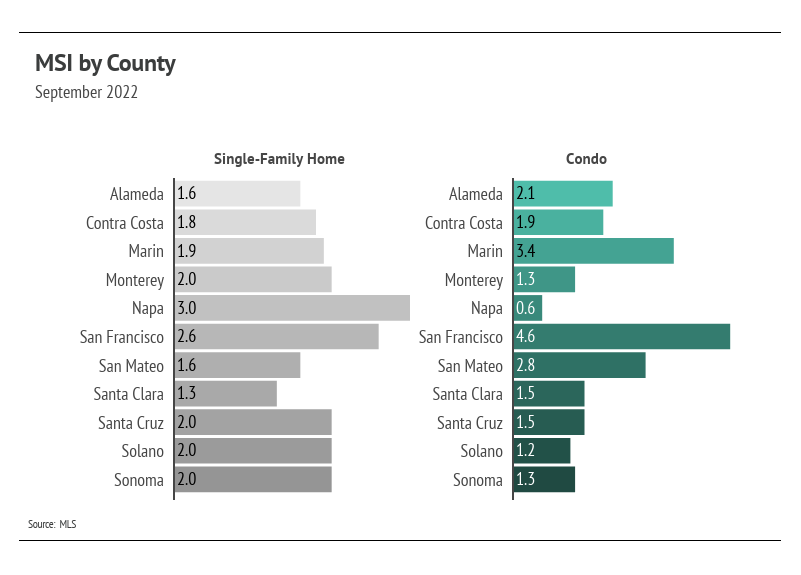
Months of Supply Inventory (MSI) quantifies the supply/demand relationship by measuring how many months it would take for all current homes listed on the market to sell at the current rate of sales. The long-term average MSI is around three months in California, which indicates a balanced market. An MSI lower than three indicates that there are more buyers than sellers on the market (meaning it’s a sellers’ market), while a higher MSI indicates there are more sellers than buyers (meaning it’s a buyers’ market). MSI has drifted higher (toward balance) over the past six months but remained far below three months of supply across the Bay Area, indicating we are still firmly in a sellers’ market, with the exception of San Francisco, which is close to balanced.
 

Local Lowdown Data

Line chart of monthly single-family home median prices across four Bay Area regions, September 2020–September 2022.

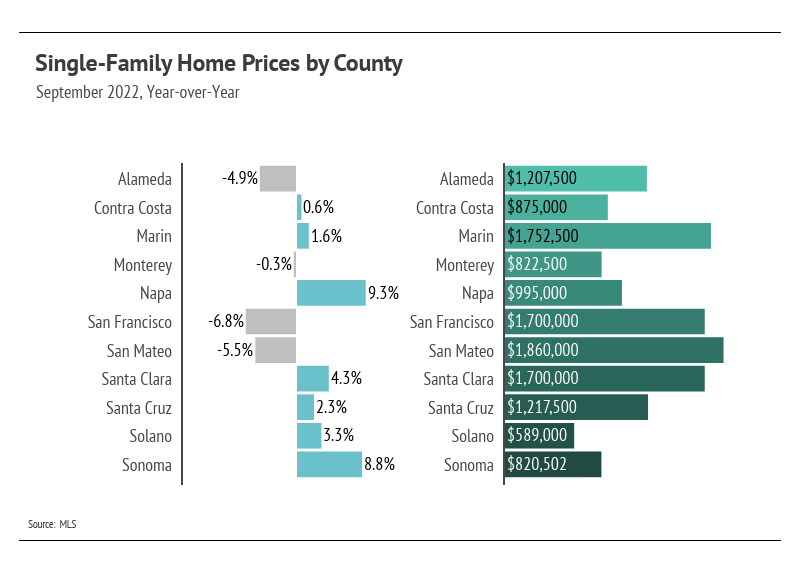
Chart comparing September 2022 year-over-year home price changes and prices across ten Bay Area counties.

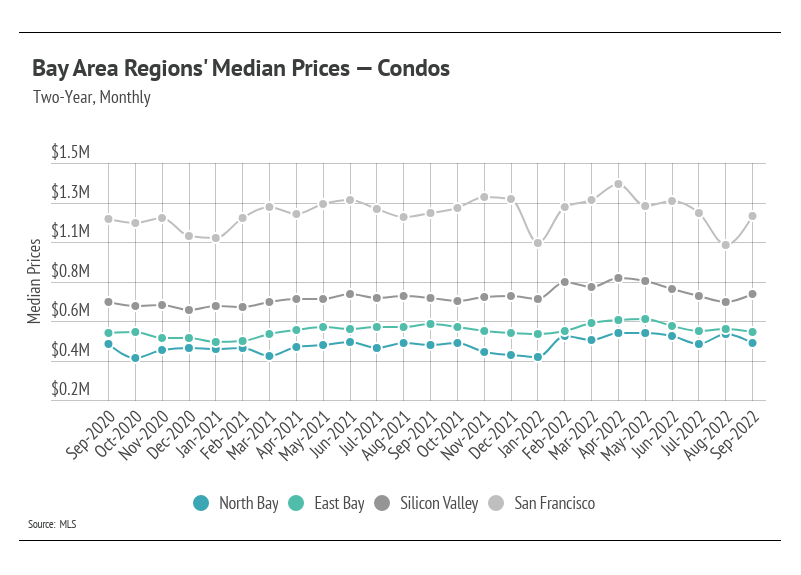
Line chart of monthly Bay Area condo median prices by region, September 2020 to September 2022.

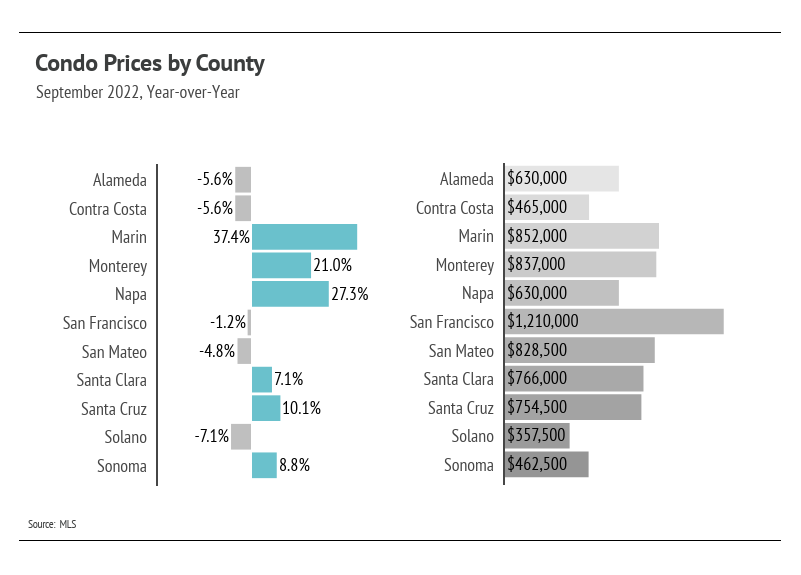
Chart comparing year-over-year condo price changes and prices across 11 Bay Area counties.

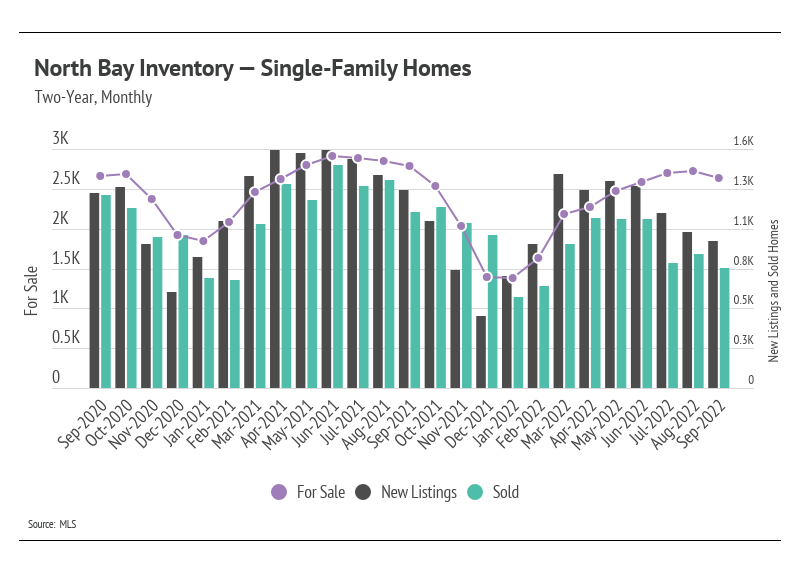
North Bay single-family home inventory chart comparing for-sale homes, new listings, and sales from September 2020 to September 2022.

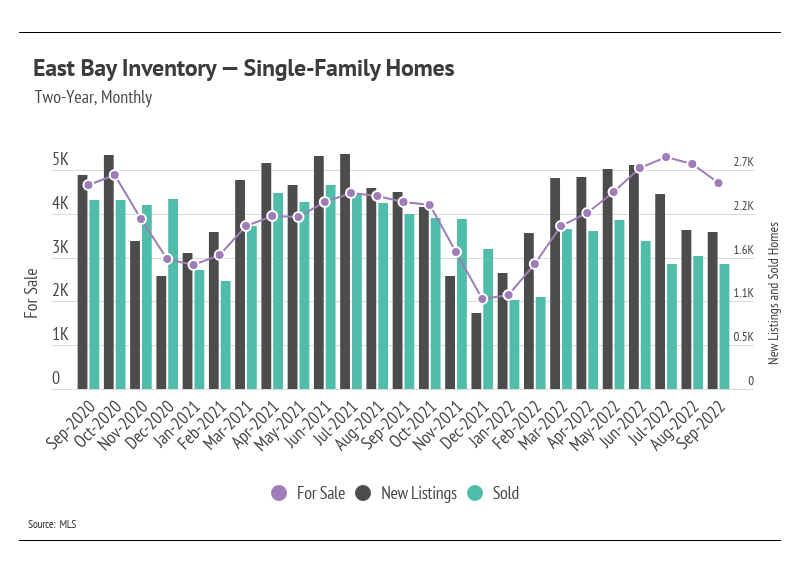
Chart comparing East Bay single-family home sales, new listings, and inventory from September 2020 to September 2022.

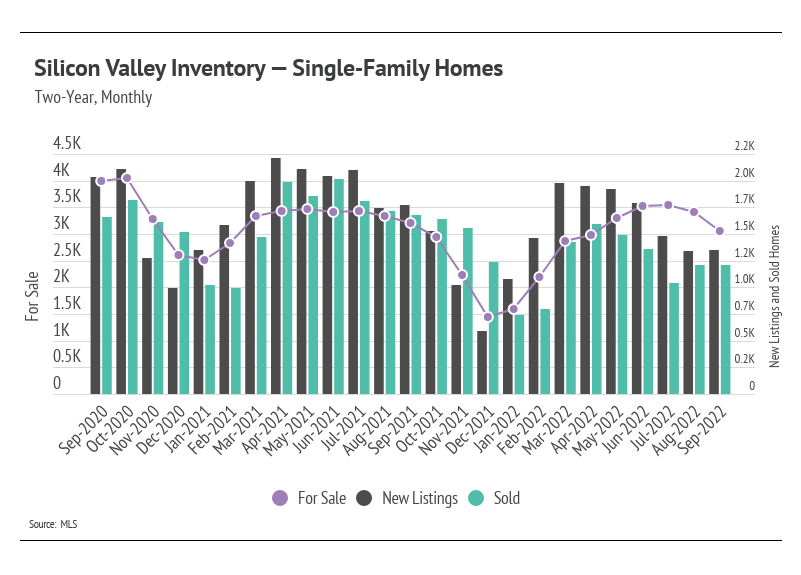
Chart of Silicon Valley single-family home sales, new listings, and homes for sale from September 2020 to September 2022.

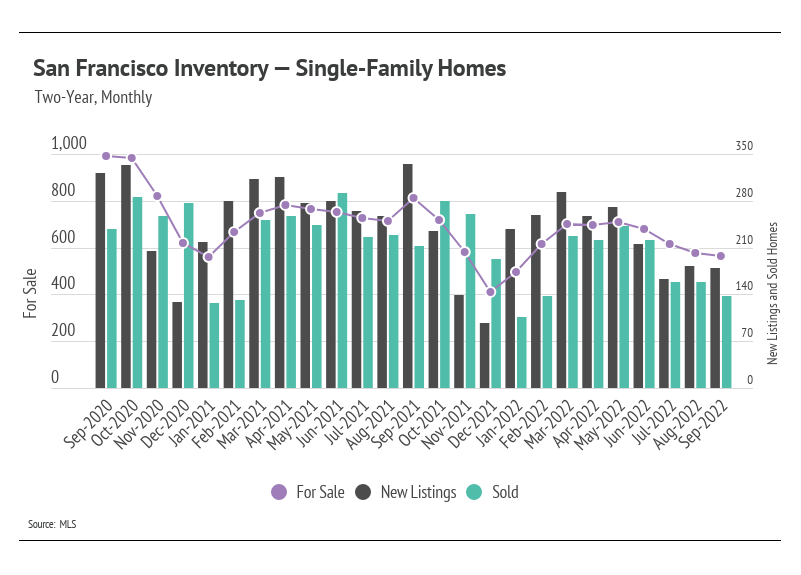
Chart tracking San Francisco single-family home inventory, new listings, and sales monthly from September 2020 to September 2022.

Line chart of Greater Bay Area single-family home days on market, comparing four regions from September 2021 to September 2022.

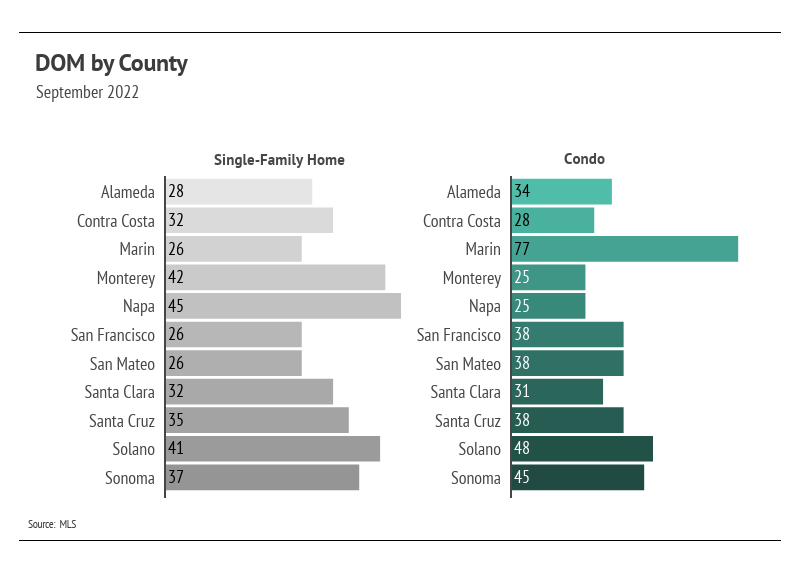
September 2022 days on market by county for single-family homes and condos, with Marin condos highest at 77 days.

Line chart comparing monthly housing supply across four Greater Bay Area regions, September 2021 to September 2022.

Bar chart comparing September 2022 months of supply for single-family homes and condos by county.

Our team is committed to continuing to serve all your real estate needs while incorporating safety protocol to protect all of our loved ones.
 
In addition, as your local real estate experts, we feel it’s our duty to give you, our valued client, all the information you need to better understand our local real estate market. Whether you’re buying or selling, we want to make sure you have the best, most pertinent information, so we put together this monthly analysis breaking down specifics about the market.
 
As we all navigate this together, please don’t hesitate to reach out to us with any questions or concerns. We’re here to support you.

Let's Talk

You’ve got questions and we can’t wait to answer them.
Follow Us on Instagram