Part 1 – Feb 2021 Bay Area Housing Market Update
Welcome back to the Bay Area Housing Market Update for the month of February! We have been very busy since the year 2021 started, the housing market has been hot in January. We have gathered new data to share with you and discuss the state of different markets in the Bay Area. Watch the video here! Part 2 of this blog can be found here.
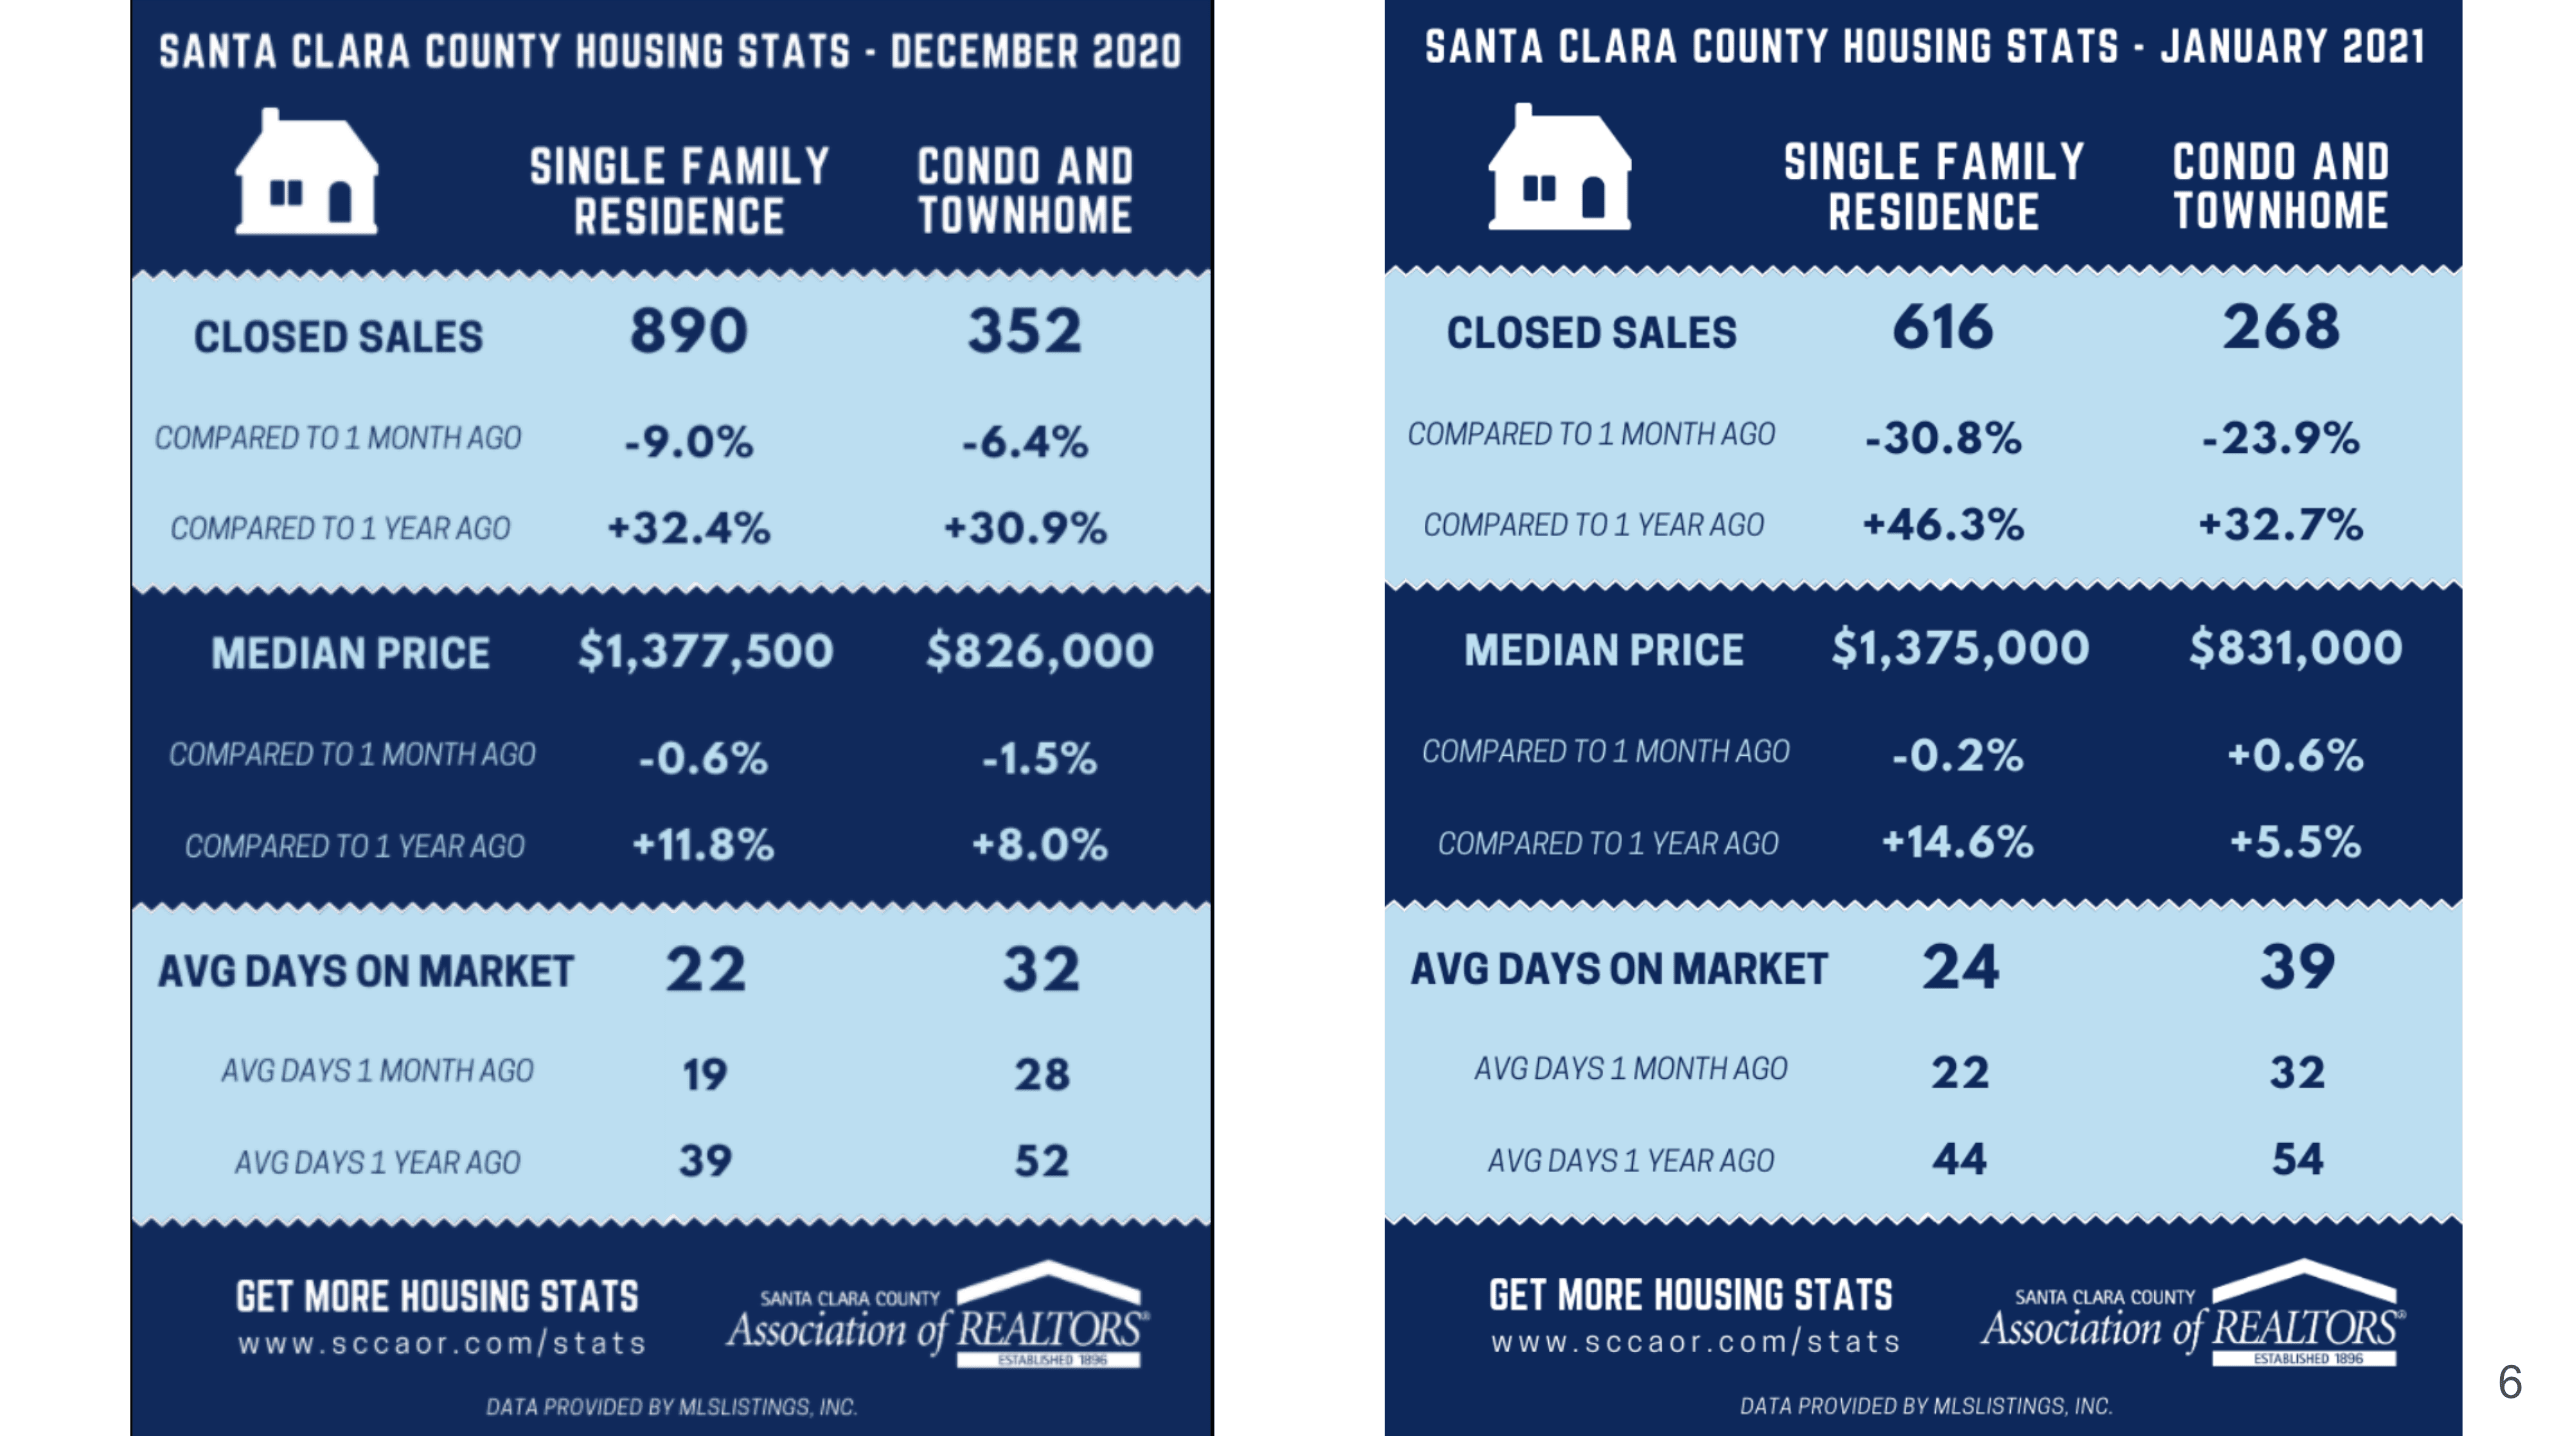
Let’s move forward to the state of the market, and there is a lot of data that I want to share with you guys. Let’s start with the Bay Area housing market statistics first. Now, this is Santa Clara County housing statistics, and we are comparing December 2020 and January 2021. As you see, in December, we had closed 890 units in terms of single-family residences, while in January only 616. It actually dropped quite a bit from a month ago, but if you look at it from a year ago, it had increased 46.3%. For condo and townhomes, it actually had dropped from last month by 23.9%, but again, it had gone up since a year ago by 32.7%. In terms of the median price, I just wanted to put side by side to see the difference between last month and this month, single-family dropped a little bit just by $2,500 to $1.375 million, and the median price for condo and townhome had actually gone up to $831,000. As you see, the pricing absolutely had gone up, and I thought it’s interesting because a lot of people really thought that the housing was going to crash in 2020, but again, the price had gone up, mostly because of the low-interest rate. We will talk more about the mortgage rates and how that has affected our housing market. The average days on the market in January is 24 days for single-family residences, and for condos and townhomes, it is about 39 days. You can still see a pretty drastic difference in terms of the number of days for single-family residences versus condos and townhomes.
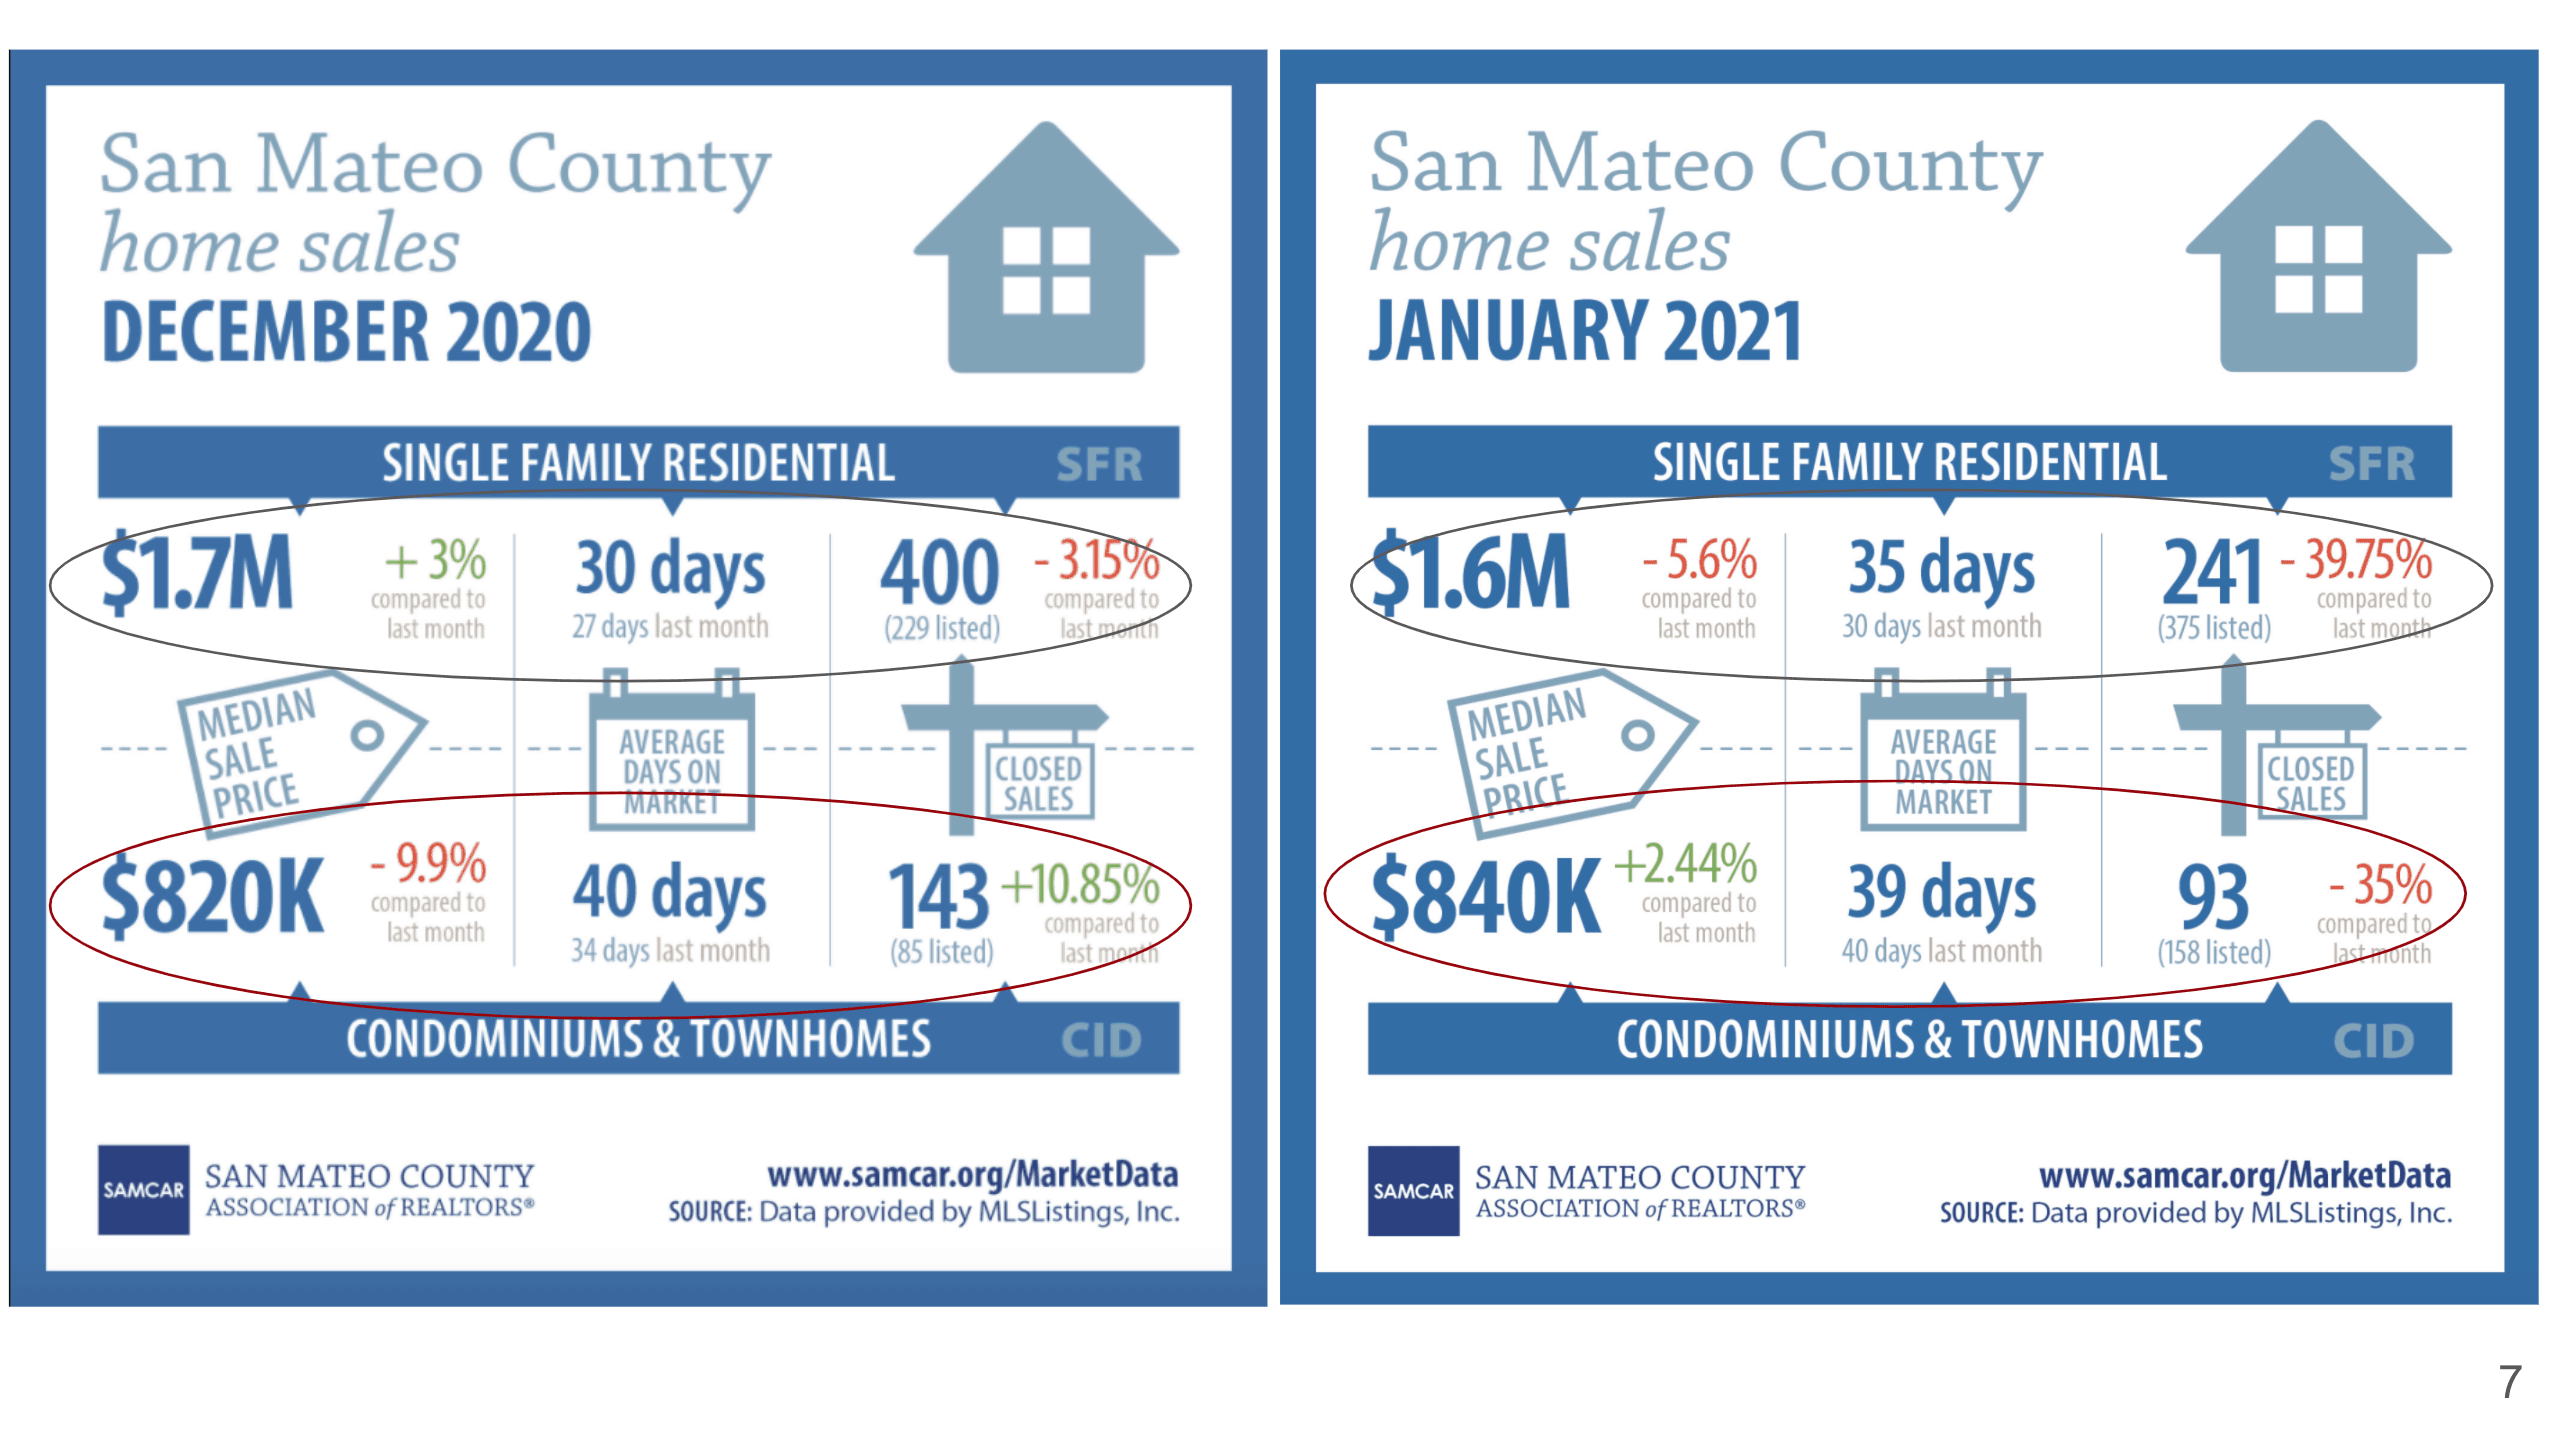
San Mateo County, in December, their median sales price is about 1.7 million dollars for a single-family. As we have mentioned for the past few months already, San Mateo County actually has a slower market compared to Santa Clara County and Alameda County. In January, you see that single-family residences had a median sales price of 1.6 million dollars, and they stayed on the market for about 35 days on average. There were a lot fewer houses sold – 241 units in January compared to 400 units in December. In terms of condos and townhomes, the median sales price actually went up a little bit by $840,000, and the average days on the market dropped slightly just by 1 day to 39 days. We also had fewer closed sales in January – 93 closed sales. The main reason is also that, typically, the inventory is a little bit lower, the sellers are not ready to have their properties listed yet. In general, in December and January, we don’t really have a high inventory because of the holiday season.
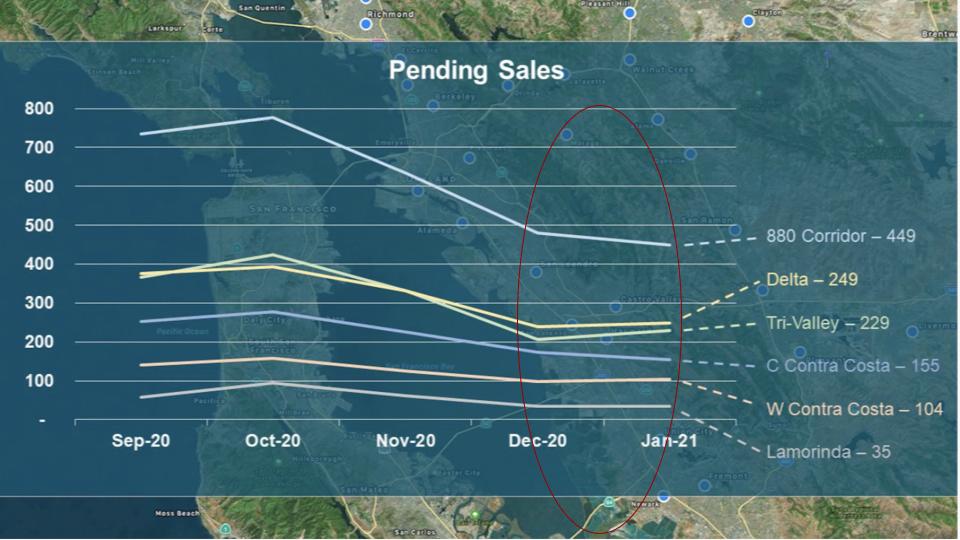
This slide is about the East Bay statistics. As you see, the number of pending sales really peaked around October, but then in all these different areas of East Bay, it had come down and stayed pretty stable for December and January. 880 corridor, you see that the pending sales have gone down slightly, as well as Central Contra Costa.
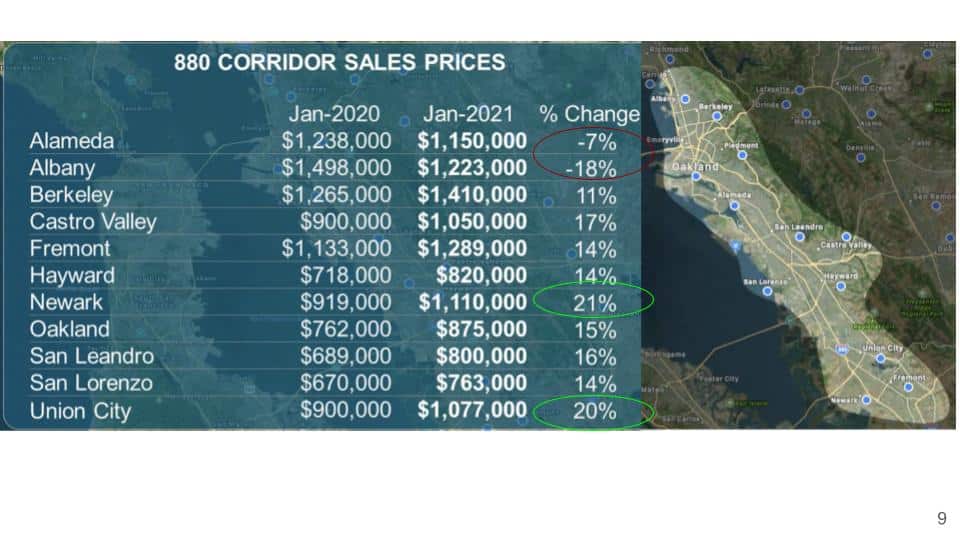
This map shows that the 880 corridor includes Fremont all the way up to Albany, so there are a few major markets that we are all very familiar with. Most of the cities have increased in double digits on their sales price, but Alameda and Albany actually have come down. Albany actually came down 18%. Newark and Union City had gone up 20% in January 2021 compared to January 2020.
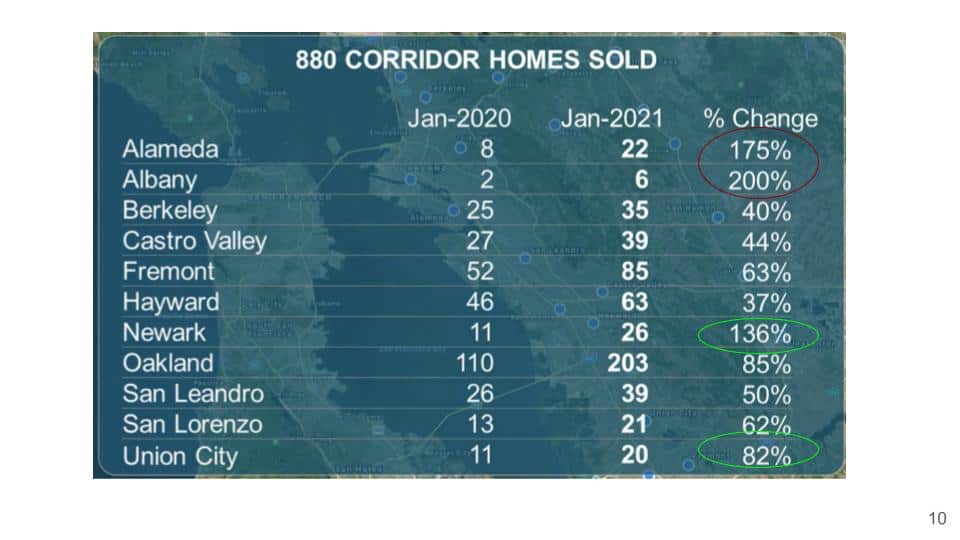
If you look at the number of homes sold in Albany, I want to emphasize that in January 2020 there were only 2 units, and 2021 had 6. Because there’s such a small number of units, the percentage is a lot bigger. Alameda went from 8 units to 22 units, so that’s a 175% increase. Newark went from 11 units to 26 units in the month of January, when you compared between 2020 and 2021, which is 136%. The same thing for Union City, the number has gone up about 82%. So you see that not only the price has gone up significantly in these areas, but there were also more homes sold as well.
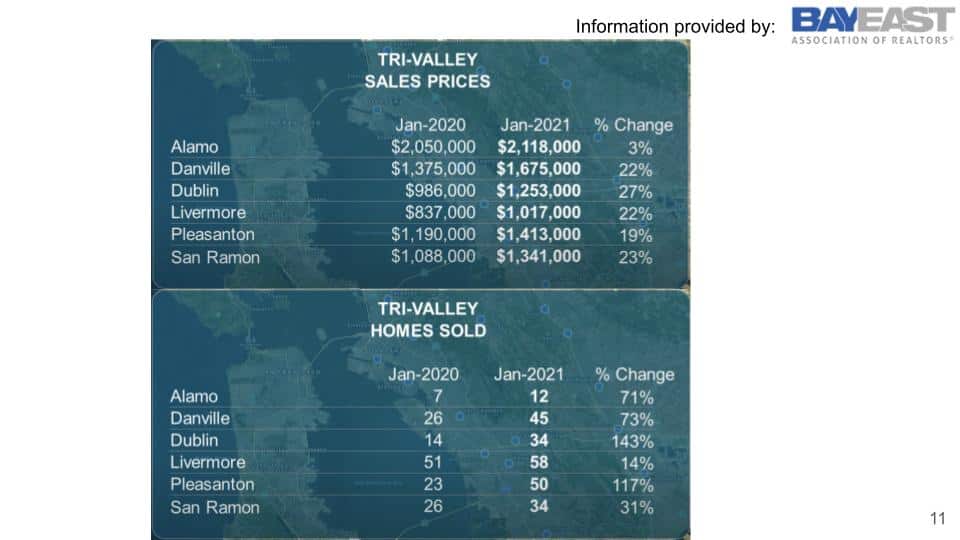
Tri-Valley includes Alamo, Danville, Dublin, Livermore, Pleasanton, and San Ramon. The same thing, the percentage changes are almost all over 20%, besides Alamo is only 3%. If you look at the number of homes sold, they all had gone up quite a bit as well.
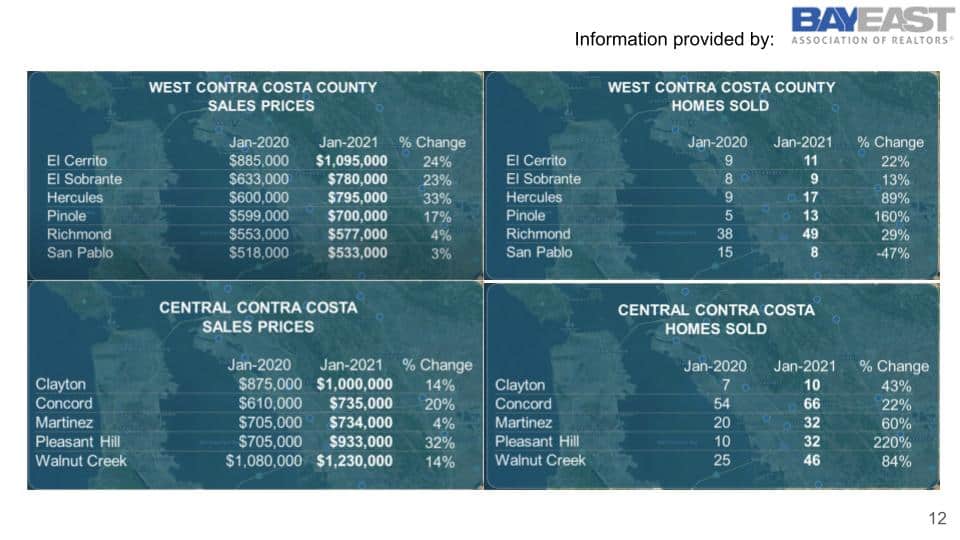
Here are just a few other areas in the East Bay, which include West Contra Costa County and El Cerrito, you see that they all went up double digits as well besides Richmond and San Pablo. It is interesting that San Pablo is the one that actually has fewer homes sold, but most of the areas they all have positive increases. If you look at Walnut Creek, it actually had increased 84% in the number of homes sold, and the price had gone up 14%. While in Pleasant Hill, the price had gone up 32%, and sold 220% more homes.
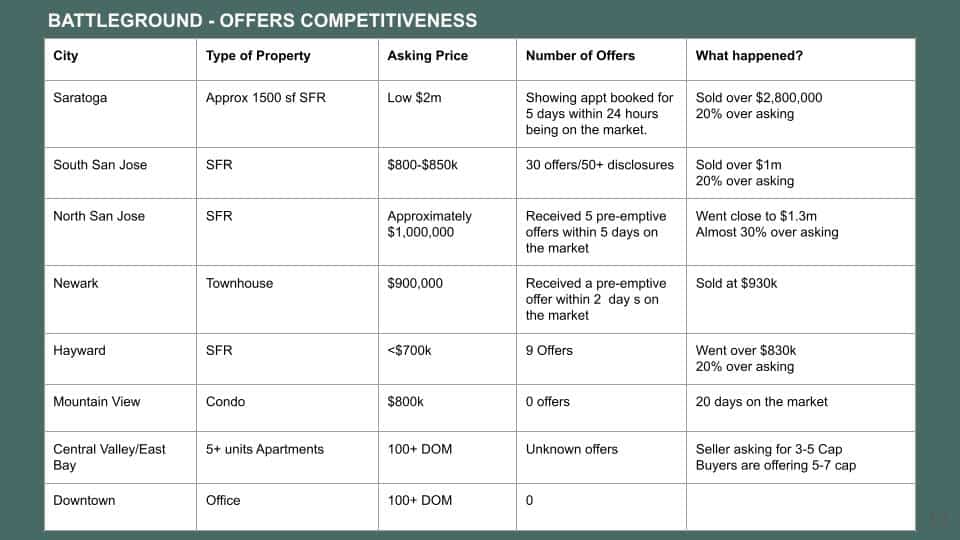
Now, what have we done? I want to share some of our experience from our team, and we gathered some offers that we know of, not necessarily we have made because sometimes it’s just too late for us even to make an offer. Here are some examples, in Saratoga, there was a single-family home, about 1500 square feet, asking price in the low 2 million dollars. As soon as it came on the market, within 24 hours the showing appointment booked full for five days, and eventually, they got preemptive offers and sold over 2.8 million dollars. South San Jose and North San Jose have very similar situations. These single-family homes are typically more updated homes, and they received tons of offers. South San Jose has been really popular, we have a lot of clients who are starting to look in the South San Jose area. It received 30 offers, sent off 50 disclosure packages, asking price was $800,000 – $850,000, and sold over a million dollars – that’s 20% over asking. Another property in North San Jose, so more like a Berryessa area, the asking price was approximately a million dollars. Within 5 days, they received 5 preemptive offers and went close to 1.3 million dollars, which’s almost 30% over the asking price. What about the East Bay? In Newark, a townhouse asked for $900,000, received a preemptive offer within two days on the market, and was sold for $930,000. A single-family home in Hayward, asking price was less than $700,000, received 9 offers, and also went 20% over the asking price. However, if you look at condos, for example, Mountain View, an absolutely beautiful location, the asking price is around $800,000, but it did not receive any offers, and it’s been 20 days on the market.
How about apartment buildings? We took a look at a few. In Central Valley/East Bay, these are all 5+ units apartment buildings, and they’ve been on the market for more than 100 days. We don’t really know if they have received any offers, all we know is that the seller is asking 3-5 cap, and the buyers are not willing to make an offer at that cap rate, they want to make offers at a much higher cap rate. For those who don’t understand the cap rate, the higher the cap rate means it is cheaper, so sellers are really asking for a lot more for their properties while buyers are still very hesitant to make very aggressive offers. This is unlike 2019 where buyers were making offers at 3 cap, they were okay with it, but right now buyers are just really taking their time.
As for office buildings, the same thing, especially in the urban area, downtown area, over 100 days on the market with no offers, very minimal increase. On the other hand, we’ve been having a lot more leasing, so we definitely see some companies expanding, especially medical practice, law, and accounting firms, so they are requiring more office space. But they’re very conservative in terms of how big of an office space they want.
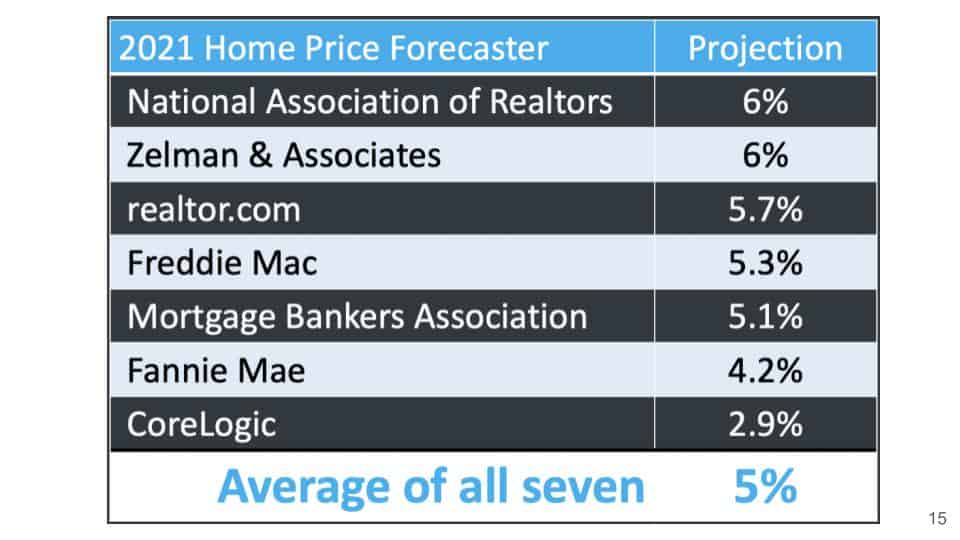
All right, so that’s what’s happening in our Bay Area housing market, and I want to share a little bit about the economic updates as well with you guys. This is a housing price forecast by different organizations. The National Association of Realtors is projecting a 6% increase this year; Zelman 6%; realtor.com 5.7%; Freddie Mac 5.3%; Mortgage Bankers Association 5.1%; Fannie Mae 4.2%; CoreLogic 2.9%. The average of all seven is 5%. I think the most important fact is that you see all of them are expecting the price to continue to go up still.
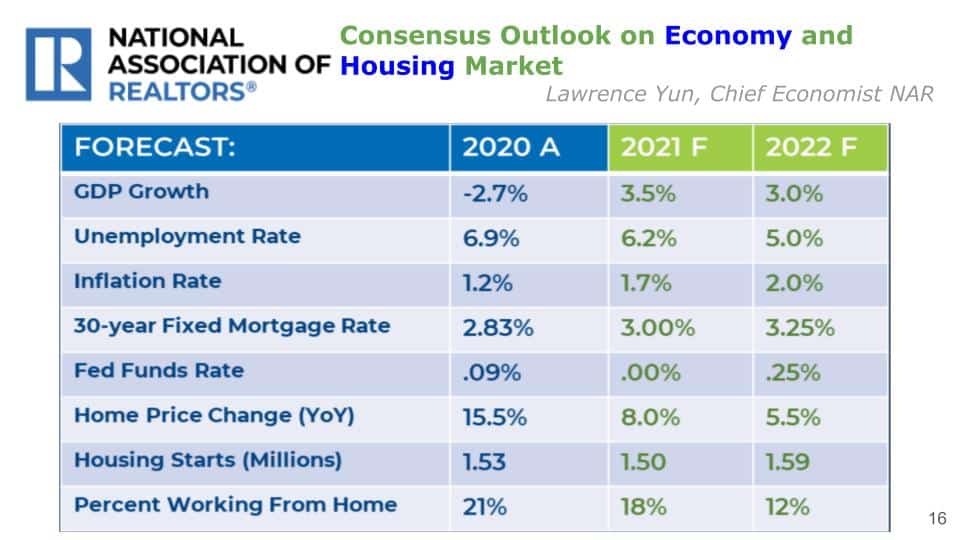
Now, from NAR(National Association of Realtors), they just did an economic housing market outlook by the chief economist Lawrence Yun. These are actual numbers from 2020, and he’s doing a forecast on 2021 and 2022. Obviously, in 2020 we had a shrink of the economy, so it was -2.7%, but he expects that the GDP growth is going to be at 3.5% in 2021, and slow down a little bit in 2022. The unemployment rate was 6.9% in 2020 and then it’s expected to come down slightly to 6.2%, and get a little bit better in 2022 at 5%. As we know that we are expecting the inflation rate to go up, which is also one of the reasons why a lot of people actually are deciding that, you know, the money sitting in the bank is not going to do anything, they better put the money into some kind of investment vehicle. The NAR is expecting that the 30-year fixed mortgage rate it’s going to go up to 3.25% in 2022. Now, the Fed Funds Rate is going to drop down to zero and it’s going to come back up in 2022. The home price change will be 8% in 2021 and 5.5% in 2022. While Housing Starts, basically talks about the developments, is about 1.53 million in 2020, actually, it’s going to come down in 2021 and then pick back up in 2022. Something new that they are sharing now was the percentage of people working from home because we start to hear, you know, what will happen if there are a lot of people working from home. They are expecting that there are going to be fewer and fewer people, of course, so in 2020 it was 21%, and then in 2021 it’s going to be 18%, and then 12% in 2022. There is a lot of news talking about companies are allowing a lot of employees to work from home, but we want to remind everybody that a lot of them are not really permanently working from home, but they are saying that they would like to have the flexibility to be able to work from home, and they still can go to the office may be just two days a week instead of the five full days a week, because they realize that the time spent on the roads is really time wasted, you could have worked a lot more. But at the same time, the person-to-person interaction is still really important. So I think we have to remind ourselves that it’s great that we are meeting each other online, but it really doesn’t replace that personal interaction.
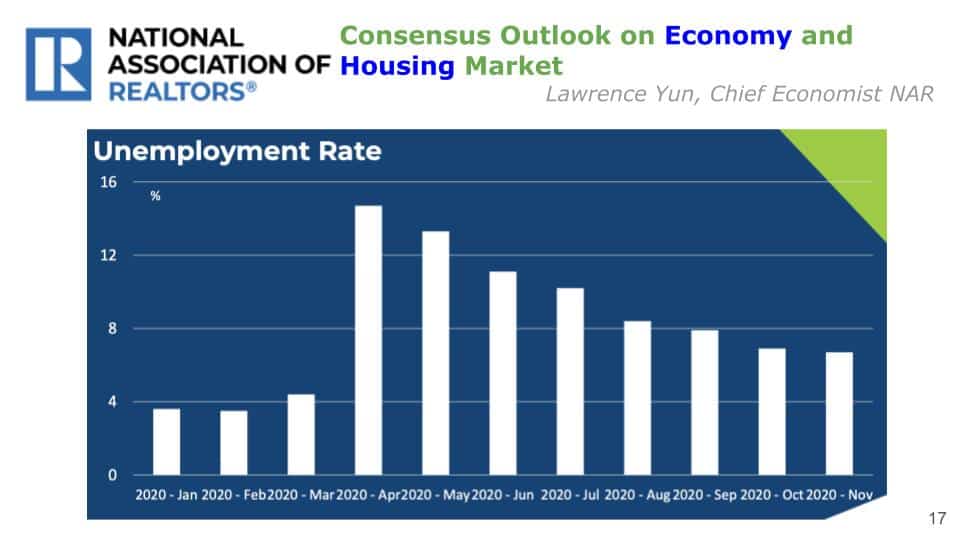
Now, I know some of you might be really curious about the employment rate because we know that this is one thing that everybody is really worried about. The employment rate had gone, obviously, sky-high in March 2020, and then started to come down. It’s getting better, but it’s nothing compared to what happened pre-COVID. As we are getting better, there are also some people who would say – well, this is not really the real unemployment rate, because it doesn’t really account for those who have already completely given up on looking for a job.
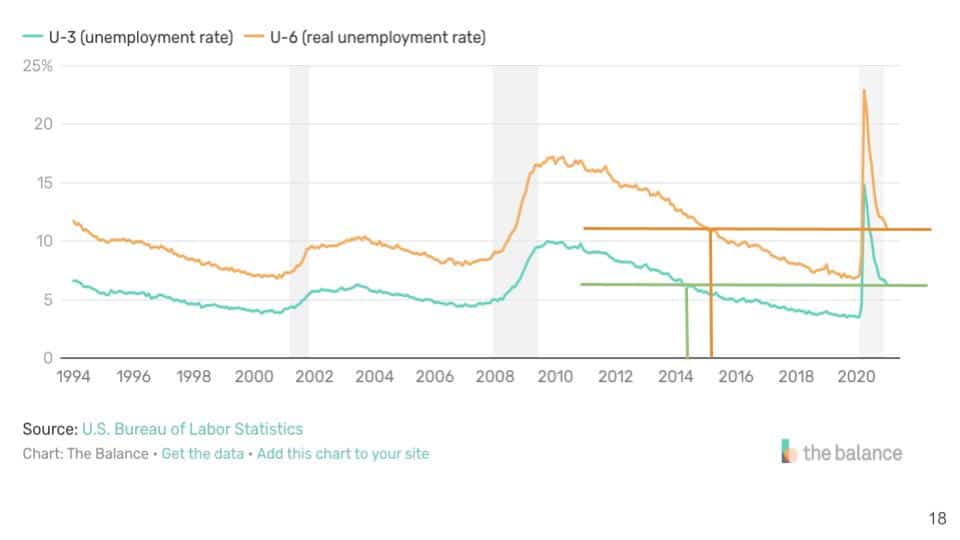
So let’s take a look at what the real unemployment rate is then. There are two lines and they are actually going pretty much parallel against each other. If you look at the data from 2020, this “real” unemployment rate is actually really close to the 2015 unemployment rate. In terms of the U-3, the regular unemployment rate, which doesn’t count for those who have completely given up on looking for jobs, is kind of similar to the 2014 level.
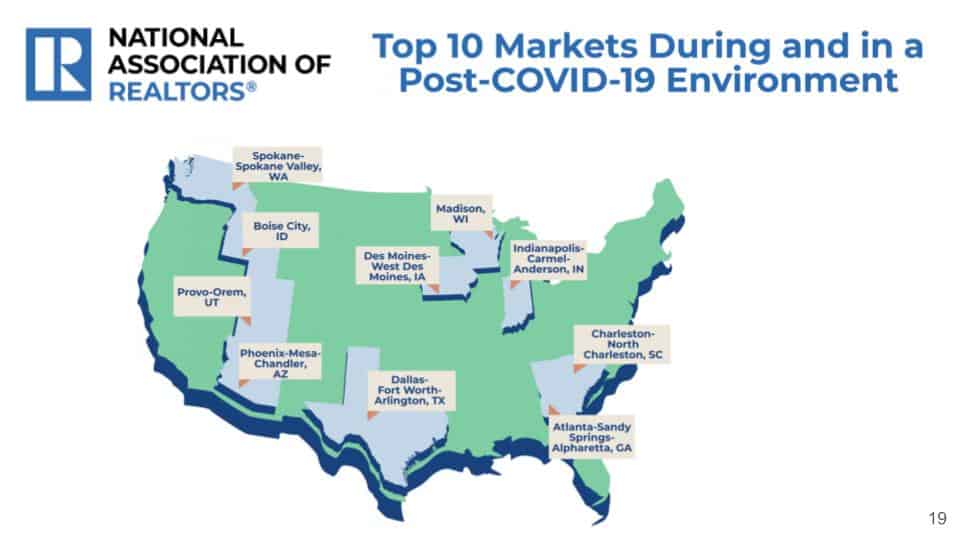
If you are asking what are the top ten markets for a post-COVID environment that can recover the best. These are some of the markets that you can take notes on. I know myself as well as Wes have invested in Dallas, so that’s good news, but these are some of the markets that are expected to be doing pretty well post-COVID.
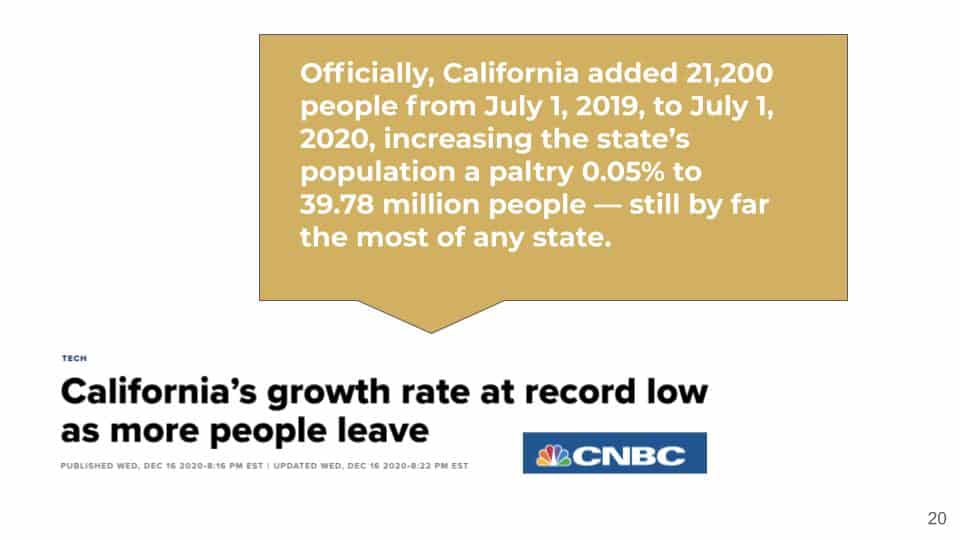
Here is another news that everybody’s been talking about regarding California’s population. CNBC had a subject line of this article – California’s growth rate at a record low as more people leave. This was published on December 16, 2020. In the article they actually said:
Officially, California added 21,200 people from July 1, 2019 to July 1, 2020, increasing the state’s population a paltry 0.05% to 39.78 million people – still by far the most of any state.
When we look at the number of people in California, we are talking about 39.78 million people, I absolutely agree that there are going to be a lot of people deciding to move away, and right now we just don’t know the exact extent of the number of people yet. We do see that trend, but we also see that there are a lot of renters who are renting somewhere else right now, because you’re allowed to work from home, or you have to work from home. Why should they rent a place in California when they have to pay so much rent, they might as well just move somewhere else with the internet, go to Hawaii or another country where they can have internet, and they can still work from home. I am still pretty positive in terms of my outlook regarding California’s population, and I don’t think this movement is going to cause a huge exodus and affect the housing market. However, I do agree that California’s tax rates, you know, being one of the highest tax rates in the country, and if we don’t do anything about it, we don’t continue to change and help encourage businesses to stay, then we are going to suffer quite a bit. I know California does have a lot of work that needs to be done to help people, but at the same time, I don’t think that it’s going to affect our housing market that much.
In addition to the regular housing market update, we have invited two mortgage industry leaders – Wes Iseley and Jeff Burns, to share their insights on mortgage loan trends and foreclosure activities, make sure to check out part 2 here! If you have any questions or comments regarding the topic, feel free to get in touch with us.
Stay up to date on the latest real estate trends.
A Bay Area Realtor's approach to schools, neighborhoods, and long-term value for families making a move


Part 1 of HAYLEN's series on the 2026 CCIM Spring Forum in Philadelphia
You’ve got questions and we can’t wait to answer them.