Quick Take:
- Silicon Valley’s housing market remains one of the strongest in the country despite some price declines over the summer months.
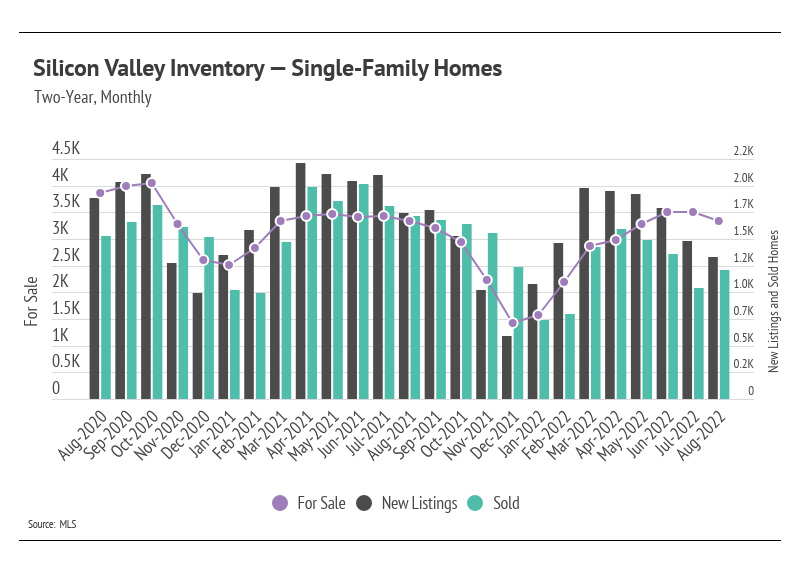
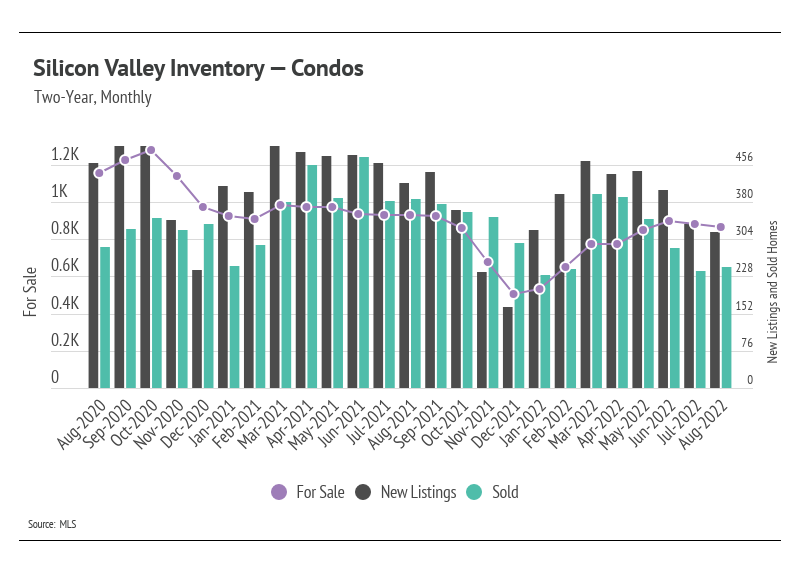
- Sales rose in August as new listings declined, dropping inventory for the first time this year.
- Months of Supply Inventory fell, halting the trend toward a more balanced market between buyers and sellers.
Note: You can find the charts/graphs for the Local Lowdown at the end of this section.
What about price growth?!
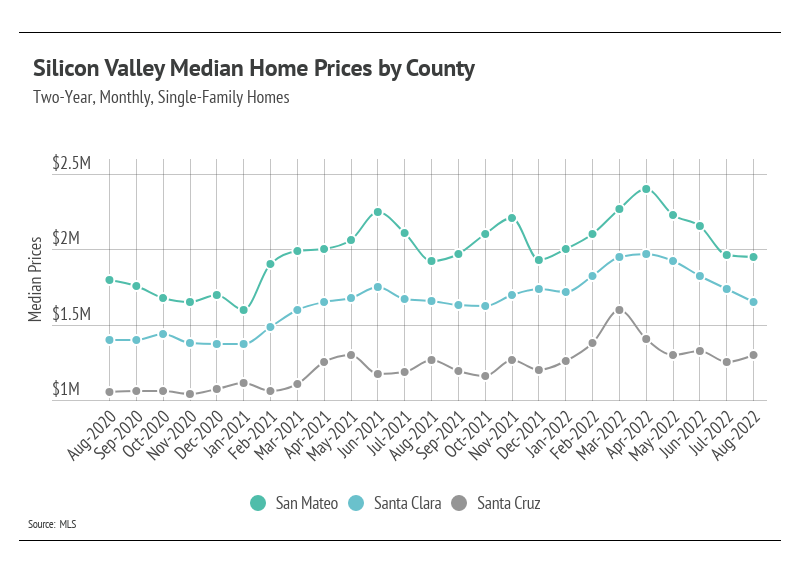
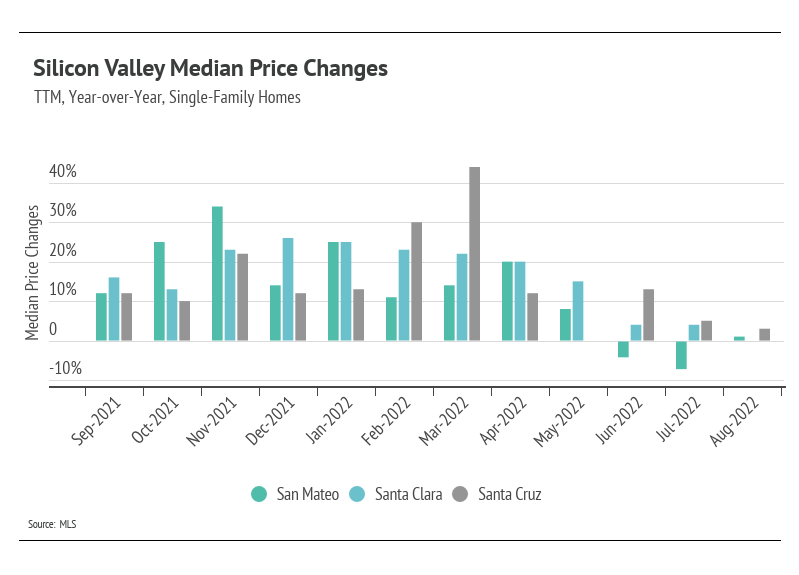
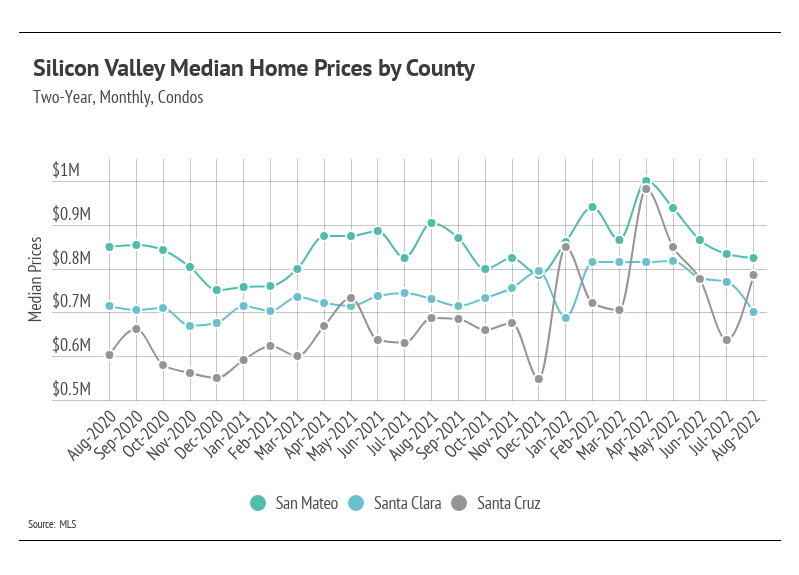
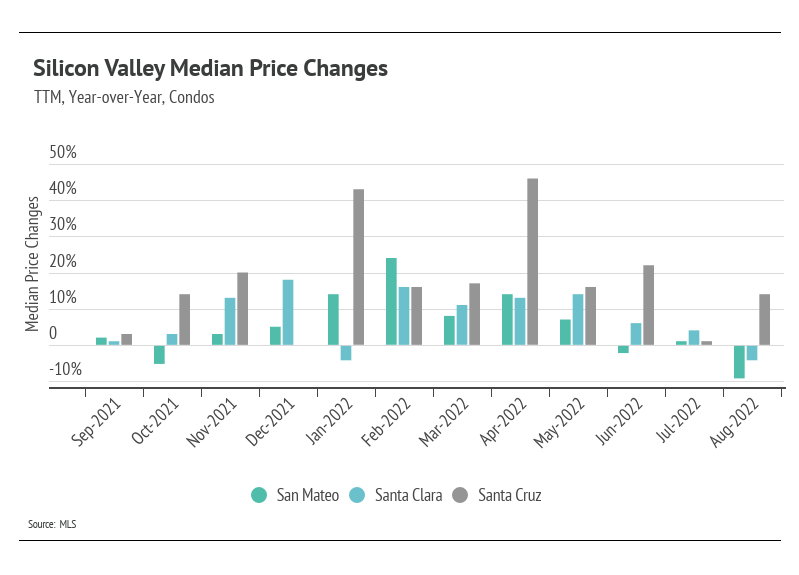
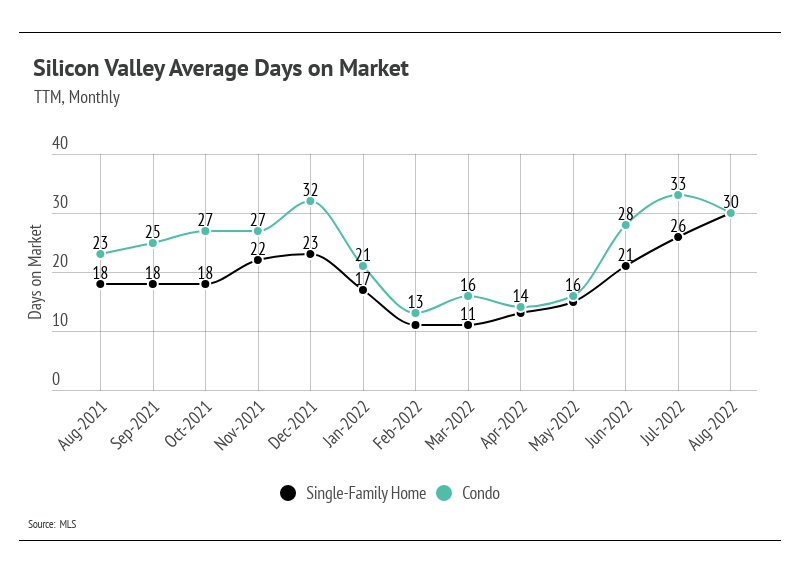
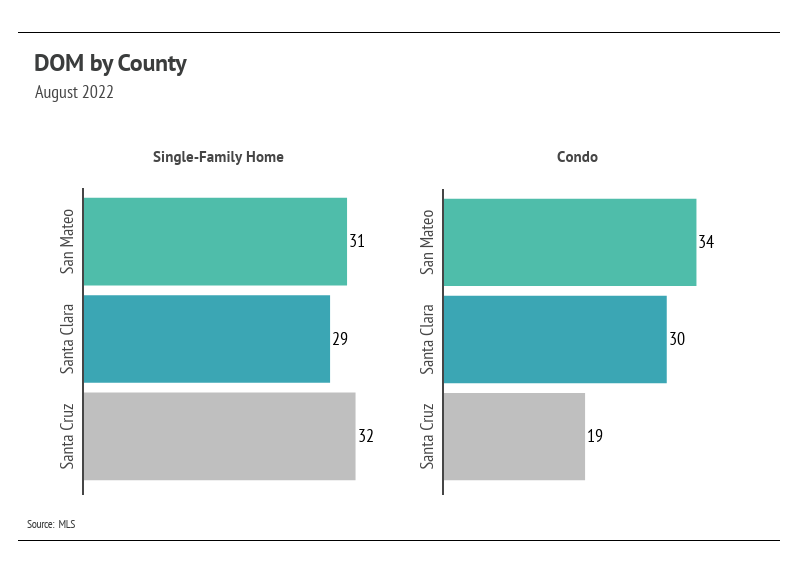
Prices tend to stagnate or decline slightly this time of year, which is exactly the case in Silicon Valley. The median single-family home and condo prices have declined off their peaks reached earlier this year. Since the peak, prices have contracted by 17% for single-family homes and 15% for condos. The price movements aren’t unexpected, as we are returning to more normal seasonal trends of price growth in the first half of the year and slight contraction in the second half. This is, of course, exacerbated by rising mortgage rates. Although the current average 30-year mortgage rate of 5.66% is still historically low, the hyper-low rates we experienced in 2020 and 2021 allowed many more buyers to enter the market. We saw firsthand what happens when demand booms in an already undersupplied market: Home prices skyrocketed. Since August 2020, single-family home prices have increased 15%, while condo prices declined slightly with the exception of Santa Cruz condos, which have increased 30%. When we link the price increases and seasonal trends with the 2.5% increase in 30-year mortgage rates, which increase the monthly mortgage payment by about 35%, we get a better picture of why sales have slowed and prices declined.
Sales increased in August, but remain low
Single-family home and condo sales increased month-over-month, while new listings declined, dropping inventory for the second month in a row. The number of homes for sale has trended lower over the past three years and settled at lower levels, which is likely the new normal for housing inventory in the country. Generally, smaller supply equates to fewer sales. For example, if 500 homes sold last year, but there are only 300 homes for sale on the market this year, it’s awfully difficult to hit more than 300 sales. There were 16% fewer homes on the market in August 2022 than in August 2020. Although 2022 has had one of the lowest inventories on record, we were pleased to see that inventory is following historical seasonal trends. With the drop in inventory in August, the peak inventory level for 2022 will undoubtedly be one of the lowest on record.
Additionally, the huge number of sales in 2021 implies a sales slowdown in the future, and the future is now. On average, people move about 12 times in their lifetime in the United States, meaning if a million more people than average buy a home one year, there’s a decent chance about a million fewer people will buy a home the next. Homes are generally not something people continuously buy year after year.
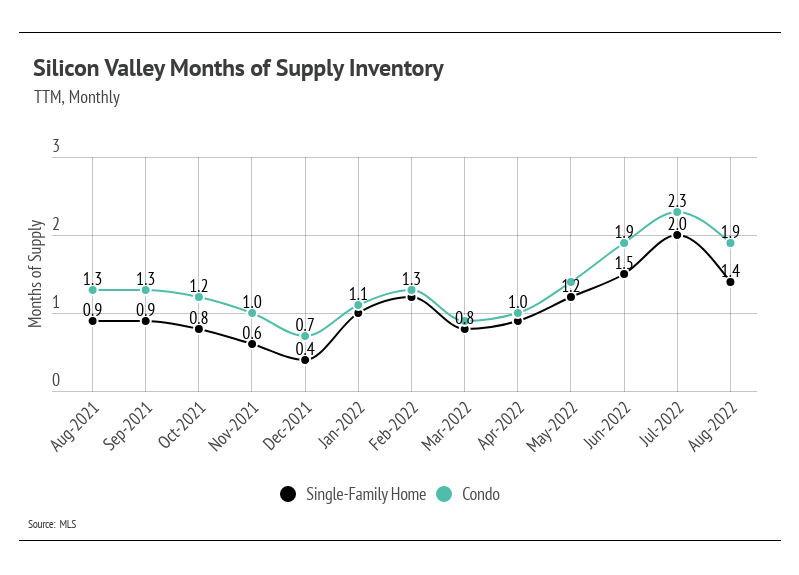
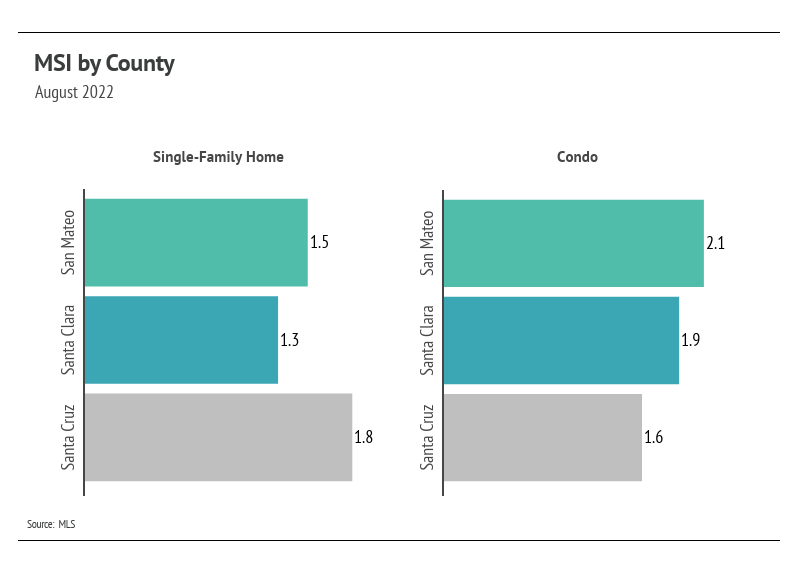
Months of Supply Inventory declined, implying a sellers’ market
Months of Supply Inventory (MSI) quantifies the supply/demand relationship by measuring how many months it would take for all current homes listed on the market to sell at the current rate of sales. The long-term average MSI is around three months in California, which indicates a balanced market. An MSI lower than three indicates that there are more buyers than sellers on the market (meaning it’s a sellers’ market), while a higher MSI indicates there are more sellers than buyers (meaning it’s a buyers’ market). From May to July, single-family home and condo MSI climbed higher (toward balance), but MSI fell in August, indicating we are still firmly in a sellers’ market.
Local Lowdown Data
Our team is committed to continuing to serve all your real estate needs while incorporating safety protocol to protect all of our loved ones.
In addition, as your local real estate experts, we feel it’s our duty to give you, our valued client, all the information you need to better understand our local real estate market. Whether you’re buying or selling, we want to make sure you have the best, most pertinent information, so we put together this monthly analysis breaking down specifics about the market.
As we all navigate this together, please don’t hesitate to
reach out to us with any questions or concerns. We’re here to support you.