September Newsletter – Housing Market Updates for the Greater Bay Area

A note on the data: We utilize data from the California Association of Realtors®, which provides an incredibly rich data set. In an effort to bring you these reports in a timely manner, for the month of September, we are using July’s numbers to analyze market trends over the first half of the year.
Single-family home prices climbed back to the highest median price on record as inventory waned and sales increased. The condo market saw a substantial increase in median prices.
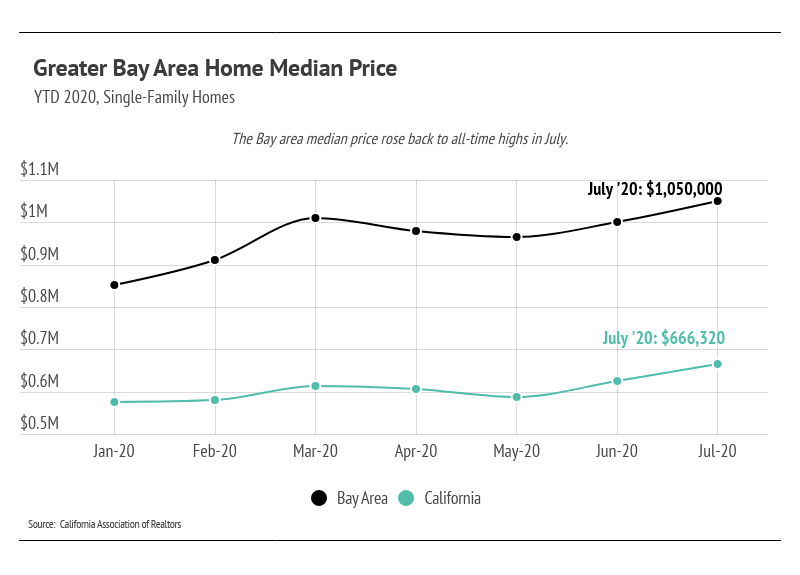
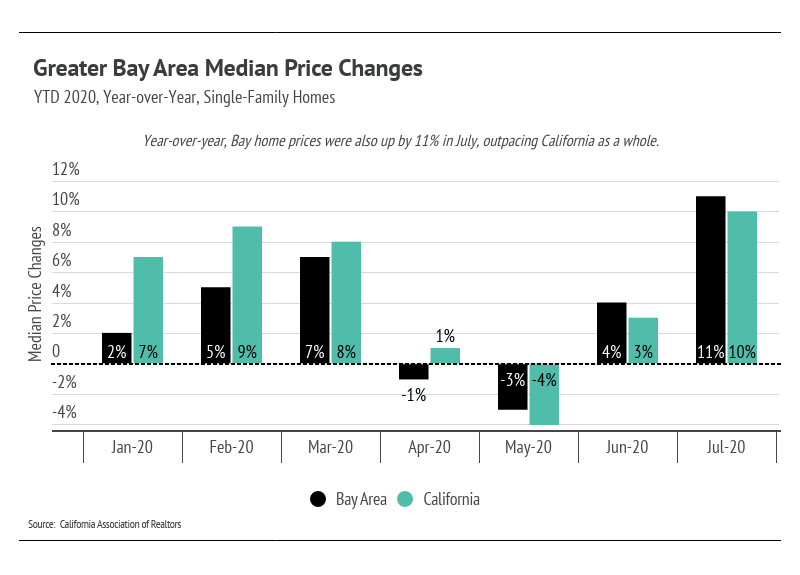
Year-over-year, single-family home prices are up 11%. The Bay market as a whole has fared well throughout the pandemic with year-over-year prices dipping briefly in April and May and rebounding in the summer months.
As we dive deeper into the county data, we see that single-family homes in all counties posted gains year-over-year.
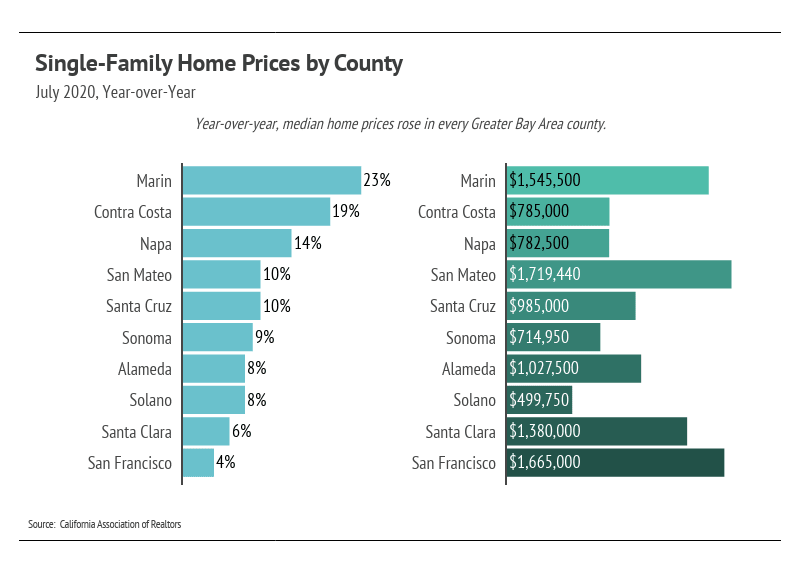
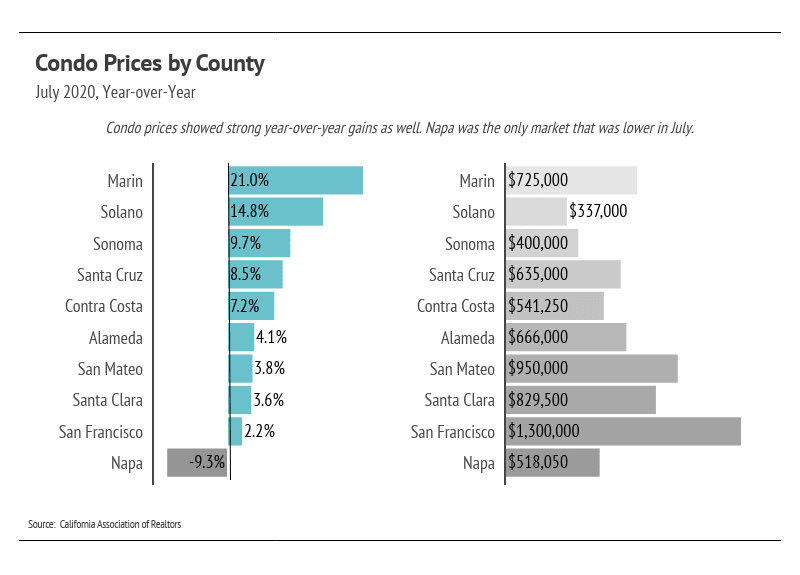
Median condo prices posted impressive gains across counties with the exception of Napa. Marin county saw significant price increases for both single-family homes and condos.
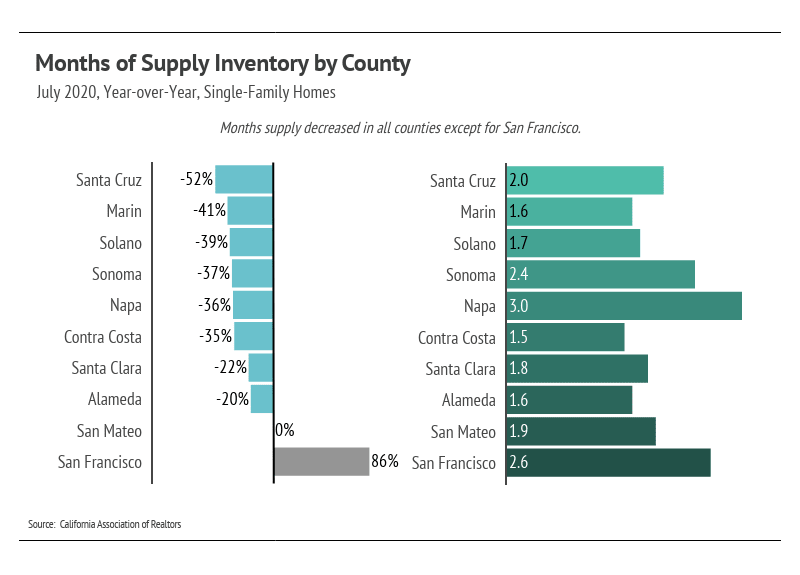
The inventory of homes for sale remains near its high for the year but are far lower than last summer. With the exception of San Francisco, inventory is lower, which we can see reflected in the increased median home prices. Lack of supply compared to demand typically buoys the Bay Area’s prices, which still remains true. Demand has remained high in the summer months, and the area may see an increase in new listings with sellers entering the market to capitalize on the favorable seller’s market.
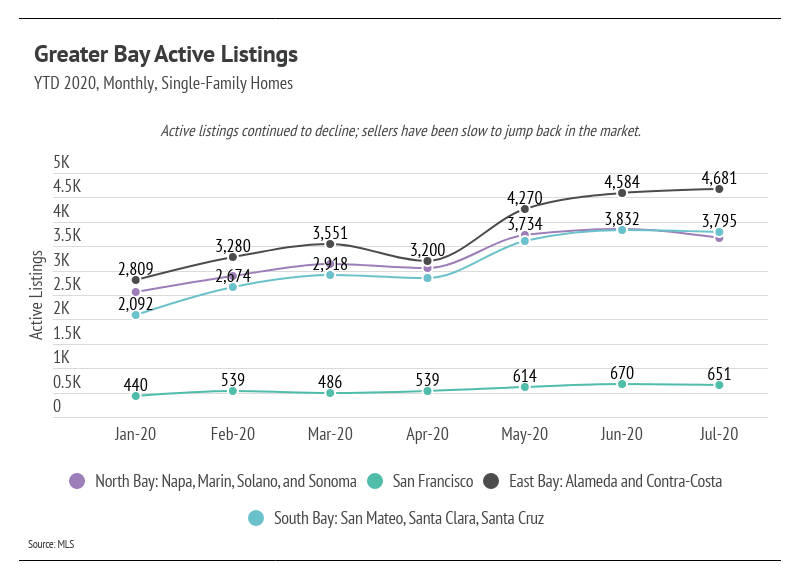
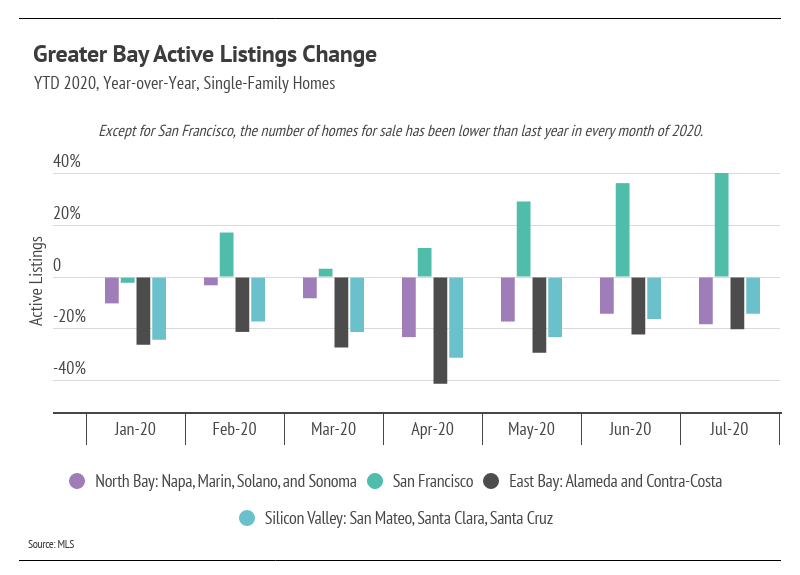
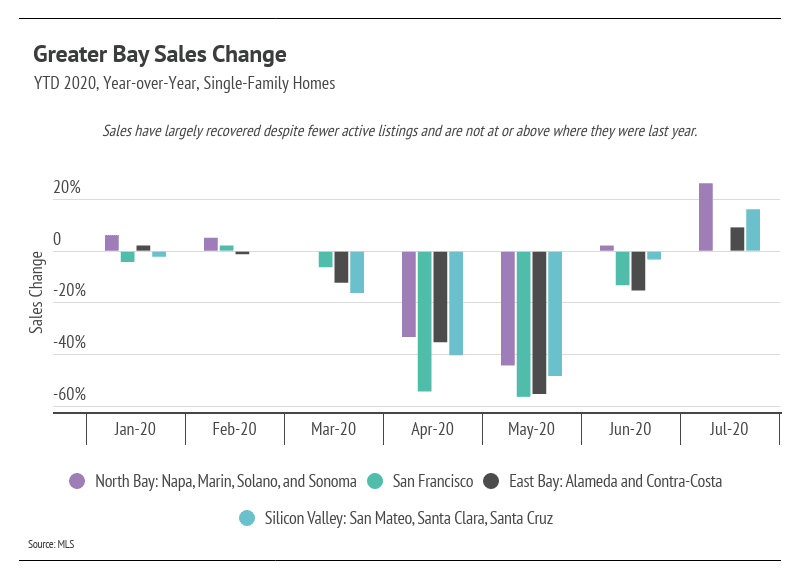
To fully appreciate the year-over-year decline in inventory, we must look at the ways in which sales behaved in 2020. During the initial months of the pandemic (March, April, and May), buyers and sellers hesitated to enter the market or entirely withdrew from it. Sellers began to reenter the market in May, thereby increasing inventory, but not to last year’s levels. Without the usual inventory, buyers have had fewer options from which to choose, and yet, sales have rebounded, surpassing last year’s numbers. We’ve seen a large year-over-year sales increase, which is an amazing recovery from the lows in May. The increase in sales shows that there is still high demand in the area, despite the lower-than-usual inventory.
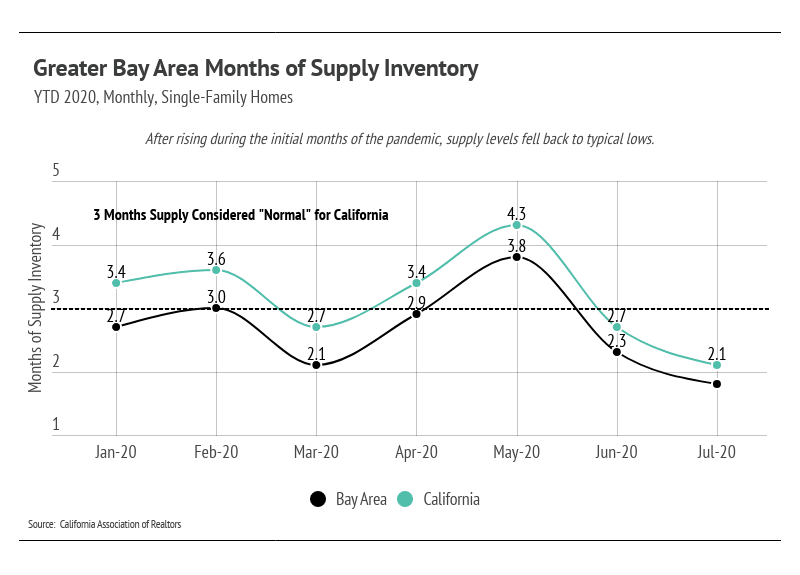
We can look to Months of Supply Inventory (MSI)—the measure of how many months it would take for all current homes for sale on the market to sell at the current rate of sales—as a metric to judge whether the market favors buyers or sellers. MSI has an average of three months in California, which indicates a balanced market. An MSI lower than three means that buyers are dominating the market and there are relatively few sellers, while a higher MSI means there are more sellers than buyers. The MSI for single-family homes fell under the three-month mark, indicating that the market is favoring sellers again. MSI decreased in all markets except for San Francisco, which is still under three months.
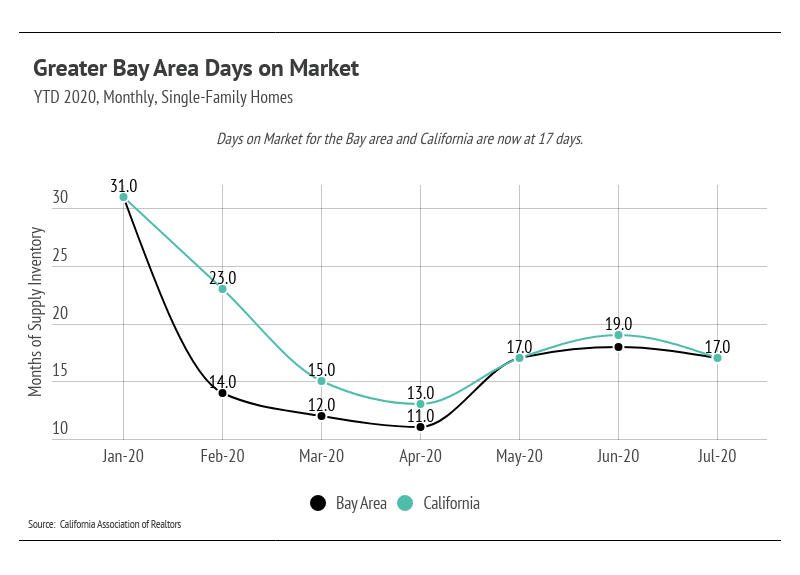
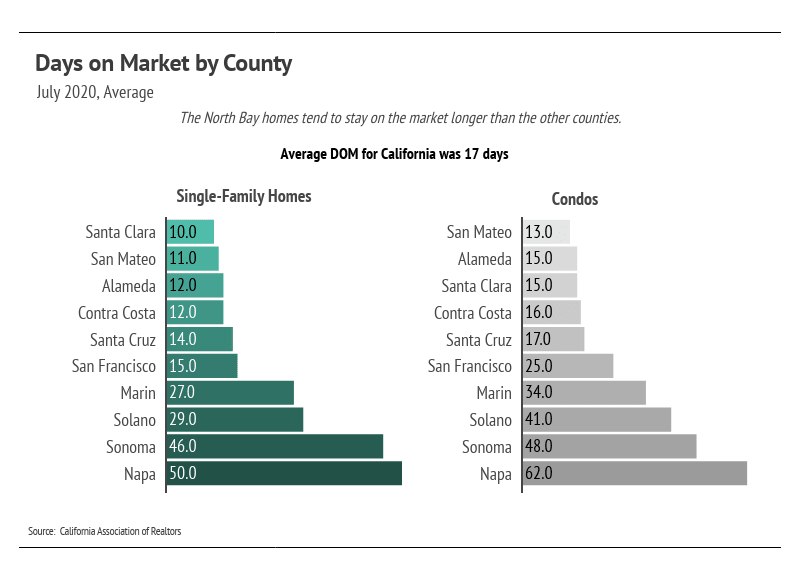
The Days on Market (DOM) decreased in July, corresponding to the increased sales, and is more in line with what we typically see in the summer season. DOM for the North Bay are noticeably higher than the other markets. Condos, generally, take longer to sell, which makes working with an agent that can differentiate the property and create a winning selling strategy even more important.
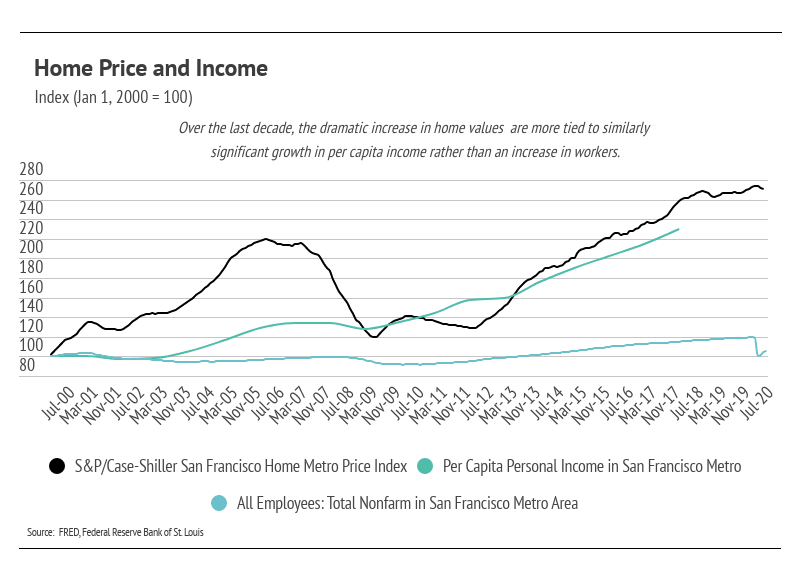
The San Francisco market gave us an interesting case study for a market that is always undersupply suddenly facing an influx of properties. Home prices have remained steady despite a large boost in inventory, especially for condos, over the last several months. San Francisco, and California in general, tend to live in a constant state of undersupply, which elevates home prices. We often are able to explain home price fluctuation through supply and demand, but recent months point toward a third factor, Per Capita Income, which explains why the large increase in supply did not cause a similar drop in price.
We found that San Francisco home prices track much more similarly to per capita income rather than working population (as a proxy for potential home demand) as shown in the chart below. Per capita income illustrates why home prices don’t immediately fall when more inventory comes to market. Simply put: home values are supported by the overall wealth in the area.
Those unaffected financially by the pandemic likely have more money than expected without the usual travel and entertainment expenses. With more expendable income and low cost financing, we expect home prices to remain stable.
In summary, the lower levels of inventory have made the market more favorable to sellers. We believe sales will continue to trend upward, which could bring more homes to the market to satisfy the demand for housing in the Bay Area. The housing market has shown its resilience through the pandemic, remaining one of the safest asset classes.
As always, we remain committed to helping our clients achieve their current and future real estate goals. Our team of experienced professionals are happy to discuss the information we have shared in this newsletter. We welcome you to contact us with any questions about the current market or to request an evaluation of your home or condo.
Stay up to date on the latest real estate trends.


And what to check before upgrading your internet plan


HAYLEN, an Asian-owned, people-first real estate firm, selected to steward real estate process for J-Sei Home’s next chapter


You’ve got questions and we can’t wait to answer them.