August 2024 Silicon Valley Market Update - Local Lowdown

August 2024 Silicon Valley Market Update - Local Lowdown
Quick Take:
  • Median home prices are slightly below peak levels across Silicon Valley. We expected price contraction after peaking in the second quarter, which is the seasonal norm. Prices will likely decline for the rest of the year.
  • Active listings, sales, and new listings declined in Silicon Valley month over month, which is normal this time of year. We expect inventory to decline and the overall market to slow as we make our way through the second half of the year.
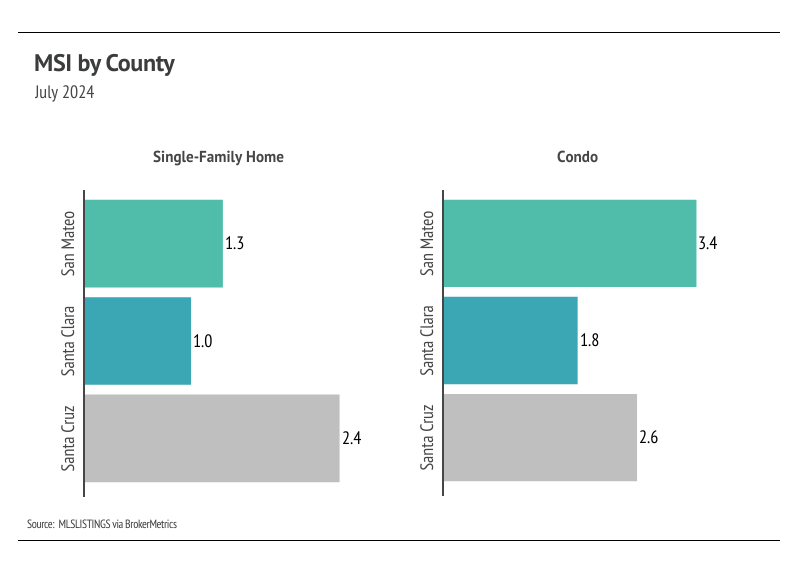
  • Months of Supply Inventory fell in July and still indicates a sellers’ market in Silicon Valley for single-family homes and condos, although the condo markets in San Mateo and Santa Cruz are closer to balanced.
Note: You can find the charts/graphs for the Local Lowdown at the end of this section.

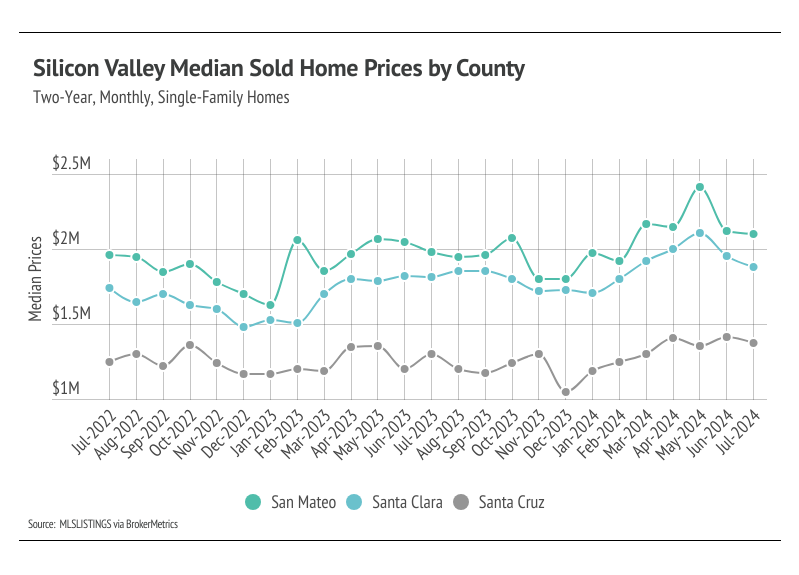
The median single-family home prices are near their all-time highs

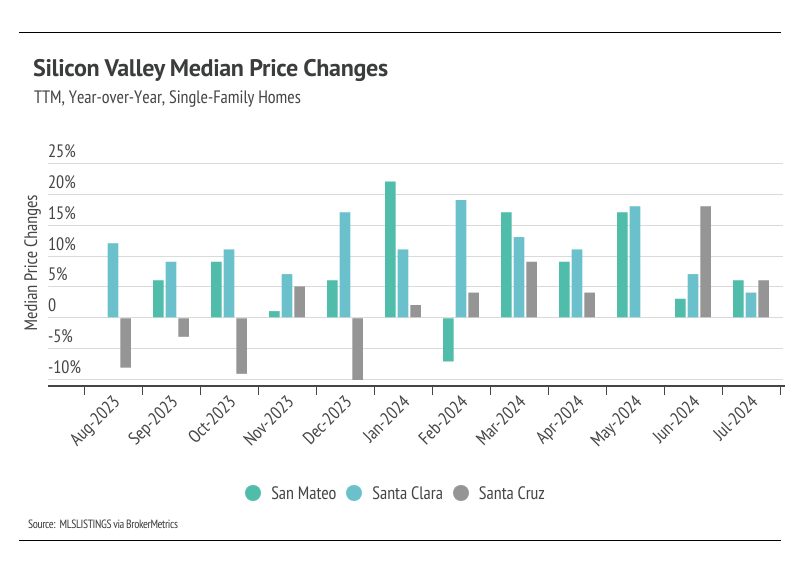
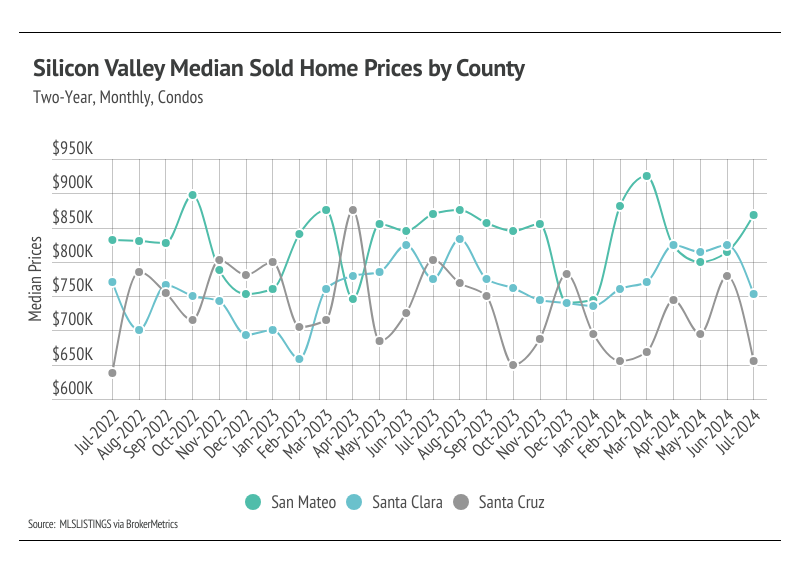
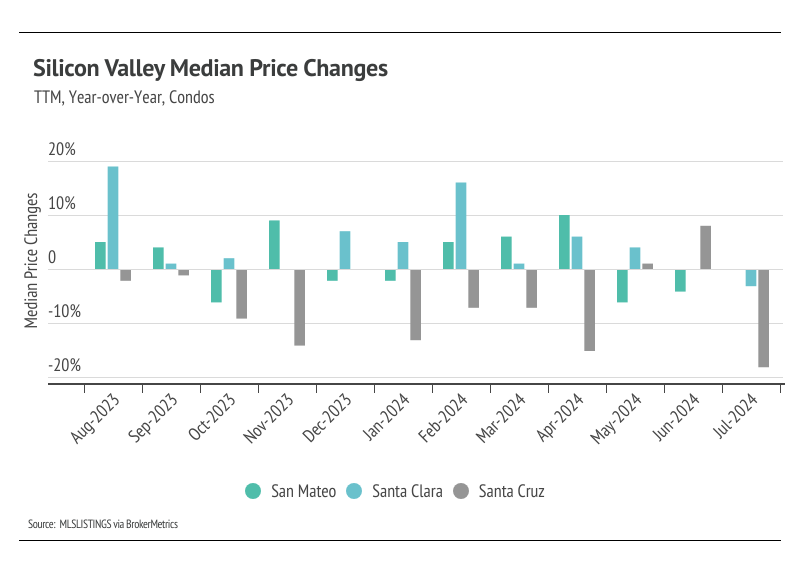
In Silicon Valley, low inventory and high demand have more than offset the downward price pressure from higher mortgage rates. Prices in Silicon Valley generally haven’t experienced larger drops due to higher mortgage rates, and as mentioned in the Big Story, higher mortgage rates are contributing to prices staying high. Year to date, in July, the median single-family home and condo prices rose across counties with the exception of condo prices in Santa Cruz, which are lower. Year over year, prices increased most significantly for single-family homes, up 6% in San Mateo and Santa Cruz and 4% in Santa Clara. Prices typically peak in the summer months, so we don’t expect new all-time highs for the rest of this year. However, we do expect some minor price contraction in the coming months. Additionally, demand is high enough that it will create price support as supply declines in the second half of the year.
 
High mortgage rates soften both supply and demand, but home buyers and sellers seemed to tolerate rates near 6%. Now that rates are declining again, sales could get a little boost, but the housing market typically begins to slow this time of year.
 

Sales, new listings, and inventory fell month over month

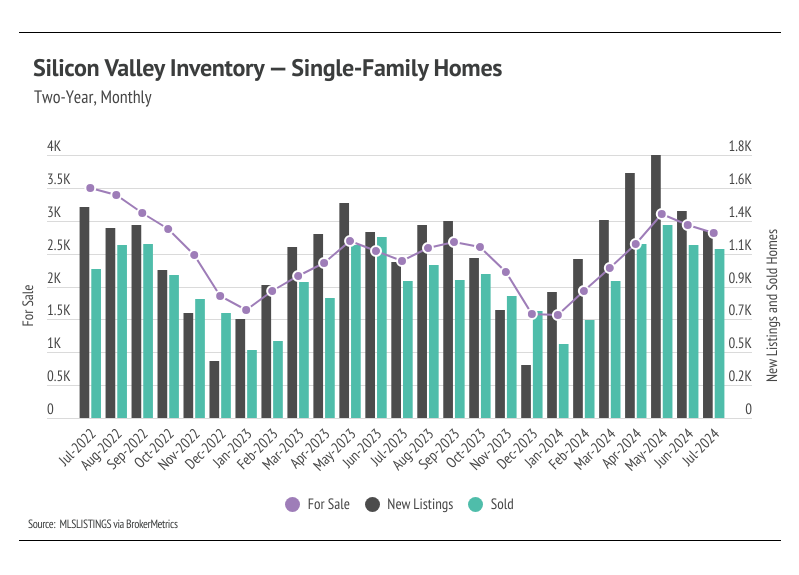
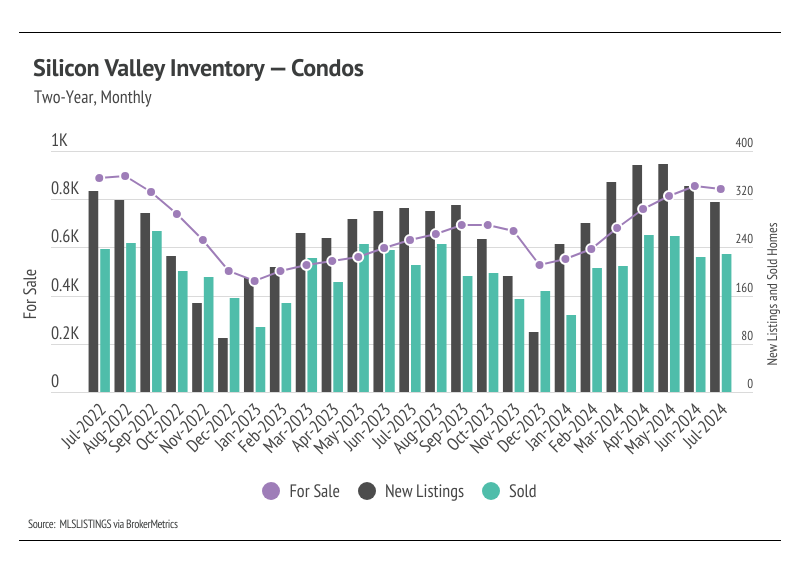
The 2024 housing market has looked progressively healthier with each passing month. We’re far enough into the year to know that inventory levels are about as good as we could’ve hoped, although single-family home inventory is still lower than we would like. In 2023, single-family home and condo inventory followed fairly typical seasonal trends, but at significantly depressed levels. Low inventory and fewer new listings slowed the market considerably last year. Even though sales volume this year was similar to last, far more new listings have come to the market, which has allowed inventory to grow. Condo inventory even rose near 2022 levels. However, for single-family homes, even though inventory is up 18% year over year, it’s still 19% lower than it was two years ago.
 
Typically, inventory begins to increase in January or February, peaking in July or August before declining once again from the summer months to the winter. It’s looking like 2024 inventory, sales, and new listings will resemble historically seasonal patterns, and at more normal levels than last year. Now that we’re more than halfway through the year, we expect inventory, sales, and new listings to decline through the rest of the year.
 

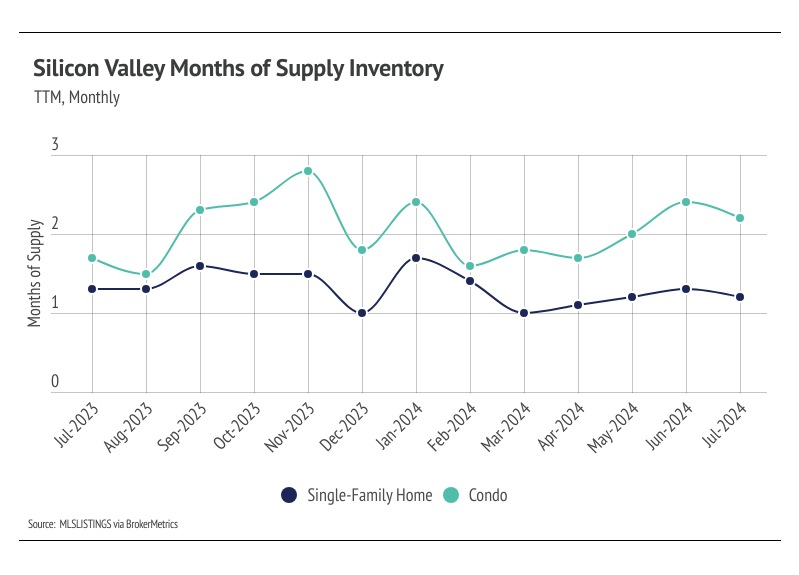
Months of Supply Inventory fell in July, still indicating a sellers’ market

Months of Supply Inventory (MSI) quantifies the supply/demand relationship by measuring how many months it would take for all current homes listed on the market to sell at the current rate of sales. The long-term average MSI is around three months in California, which indicates a balanced market. An MSI lower than three indicates that there are more buyers than sellers on the market (meaning it’s a sellers’ market), while a higher MSI indicates there are more sellers than buyers (meaning it’s a buyers’ market). The Silicon Valley market tends to favor sellers, which is reflected in its low MSI. MSI trended higher in the second half of 2023, but never climbed above three months of supply. In Q1 2024, however, the Silicon Valley MSI fell significantly, before rising significantly in Q2. In July, MSI declined, indicating the single-family home and condo markets still favor sellers.
 

Local Lowdown Data

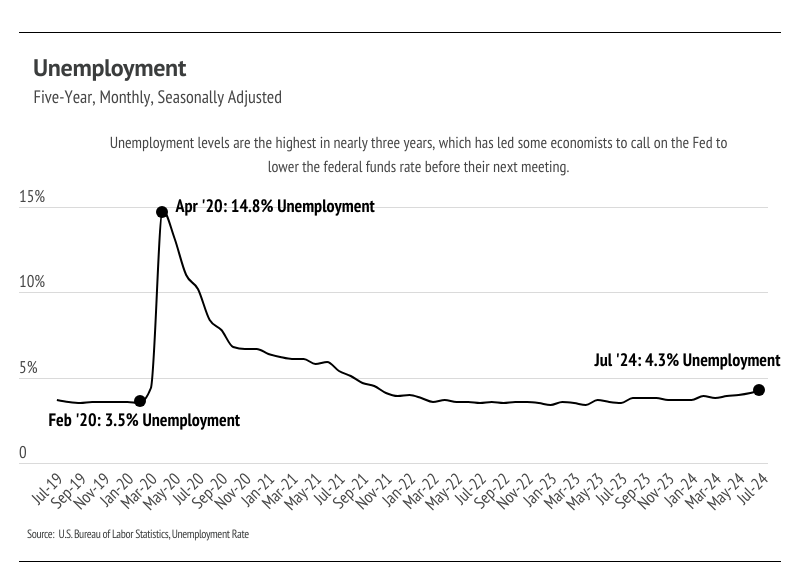
U.S. unemployment rate chart, peaking at 14.8% in April 2020 and ending at 4.3% in July 2024.
Line chart comparing monthly median single-family home prices in San Mateo, Santa Clara, and Santa Cruz counties.
Bar chart comparing year-over-year median price changes for single-family homes across three Silicon Valley counties.
Line chart comparing monthly median condo sale prices in San Mateo, Santa Clara, and Santa Cruz counties, July 2022–July 2024.
Bar chart of year-over-year condo price changes in San Mateo, Santa Clara, and Santa Cruz counties, August 2023–July 2024.
Chart of Silicon Valley single-family home inventory, showing homes for sale, new listings, and sales from July 2022 to July 2024.
Chart of Silicon Valley condo inventory, new listings, and sales from July 2022 to July 2024.
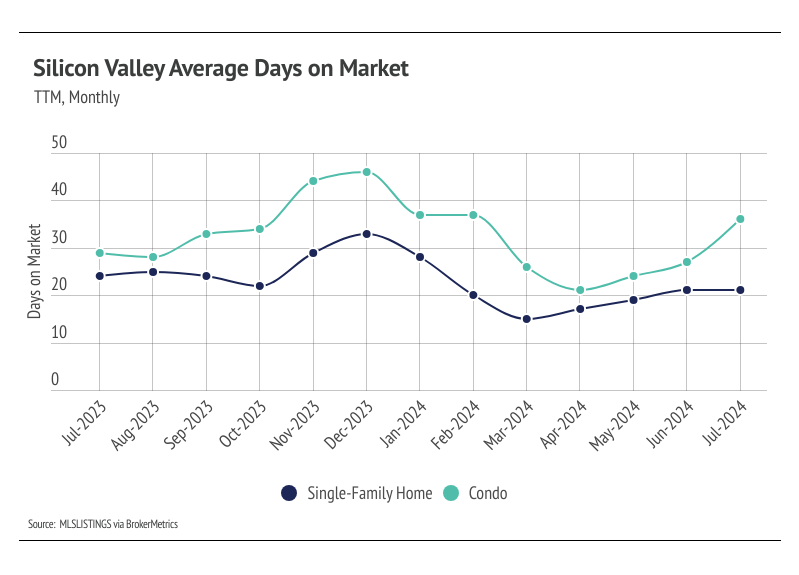
Line chart comparing monthly days on market for Silicon Valley single-family homes and condos, July 2023–July 2024.
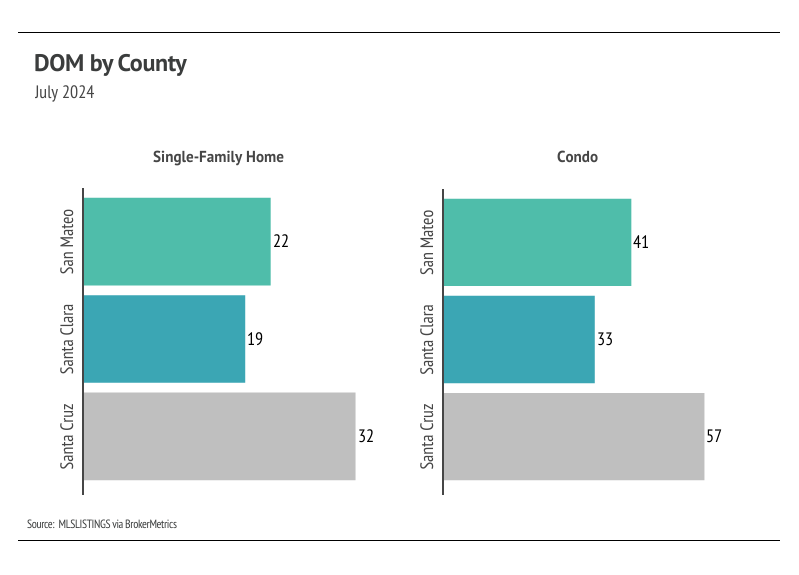
Chart comparing July 2024 days on market by county for single-family homes and condos.
Line chart comparing monthly months of supply for single-family homes and condos, July 2023–July 2024.
July 2024 MSI by county chart comparing single-family homes and condos in San Mateo, Santa Clara, and Santa Cruz.
 
As your local real estate experts, we feel it’s our duty to give you all the information you need to better understand our local real estate market. Whether you’re buying or selling, we want to make sure you have the best, most pertinent information. Please don’t hesitate to reach out to us with any questions or concerns. We’re here to support you.

Let's Talk

You’ve got questions and we can’t wait to answer them.

Follow Us on Instagram