Bay Area Multifamily Market Updates | Feb 2023
Welcome to the February 2023 Bay Area multifamily updates! Watch the recording of this episode here on our YouTube channel.
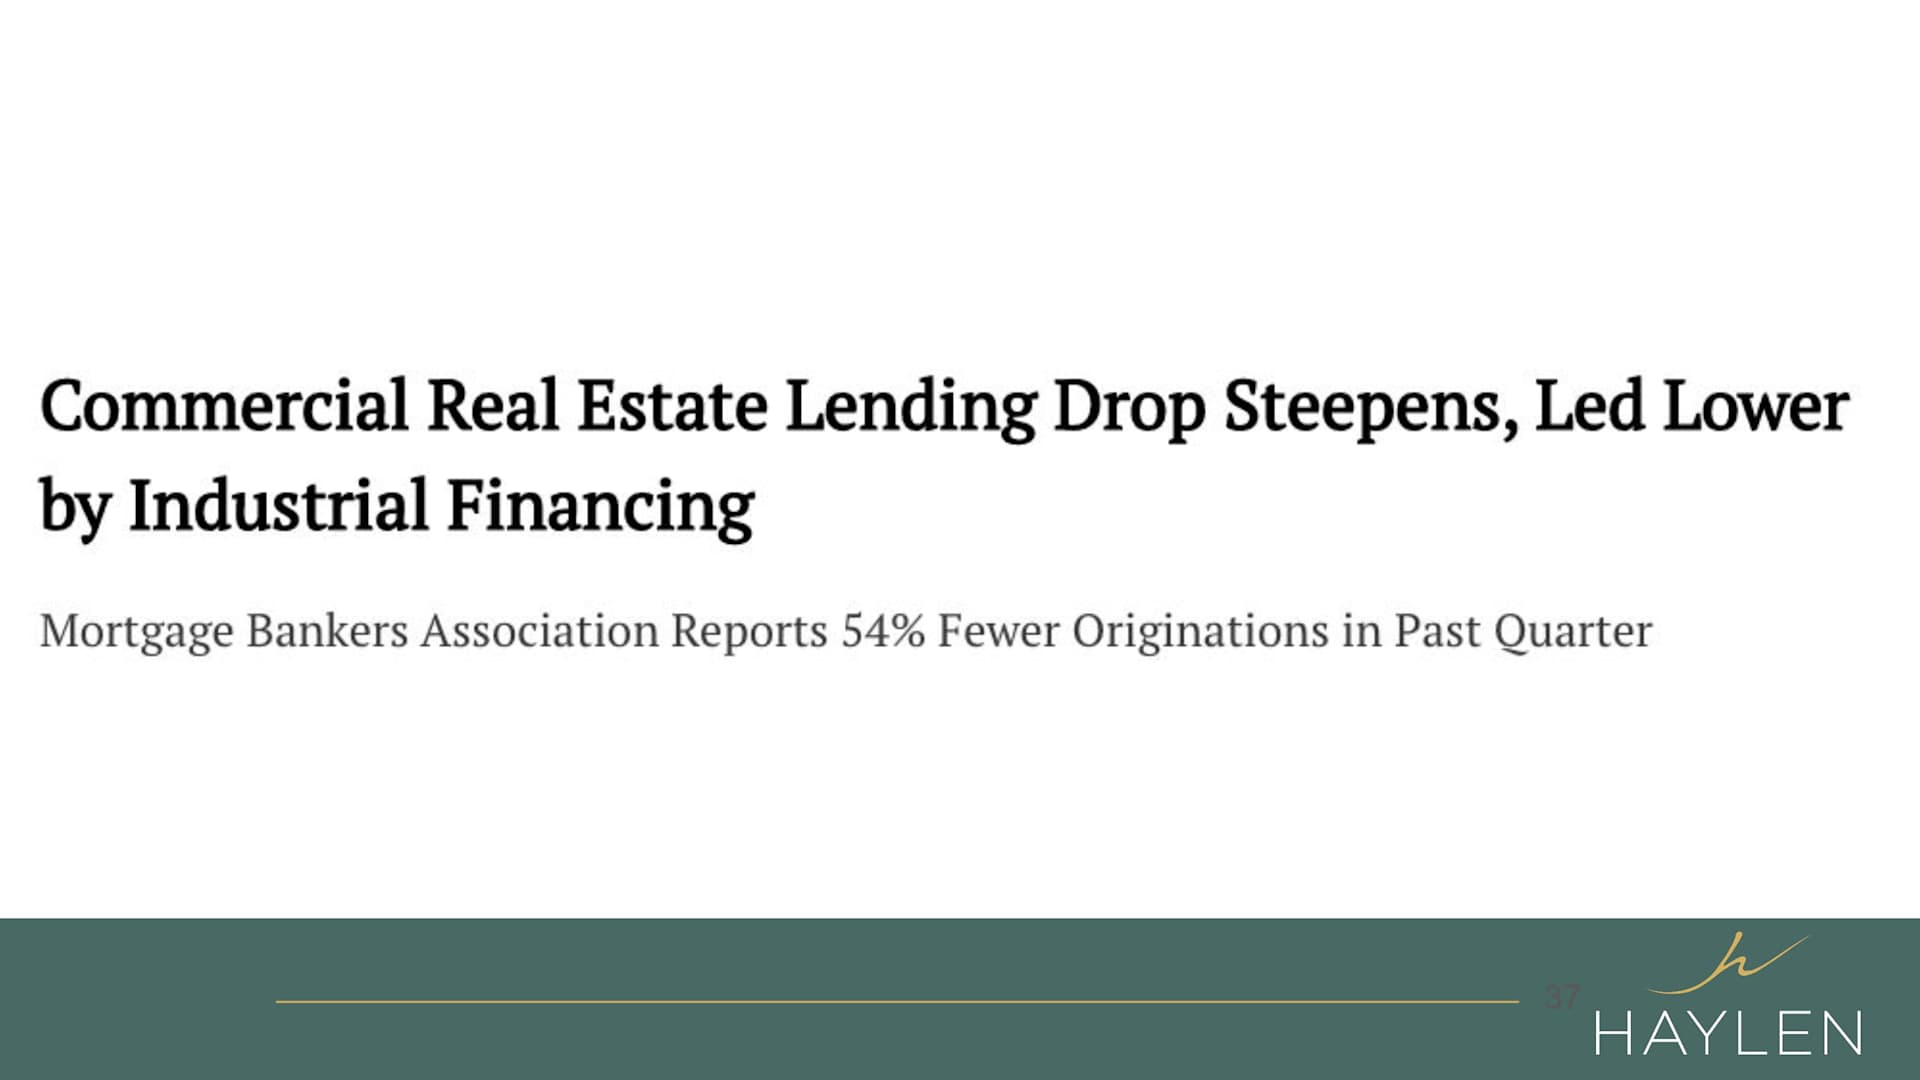
The commercial real estate market has dropped quite a bit, lending already dropped 54% less originations last quarter.
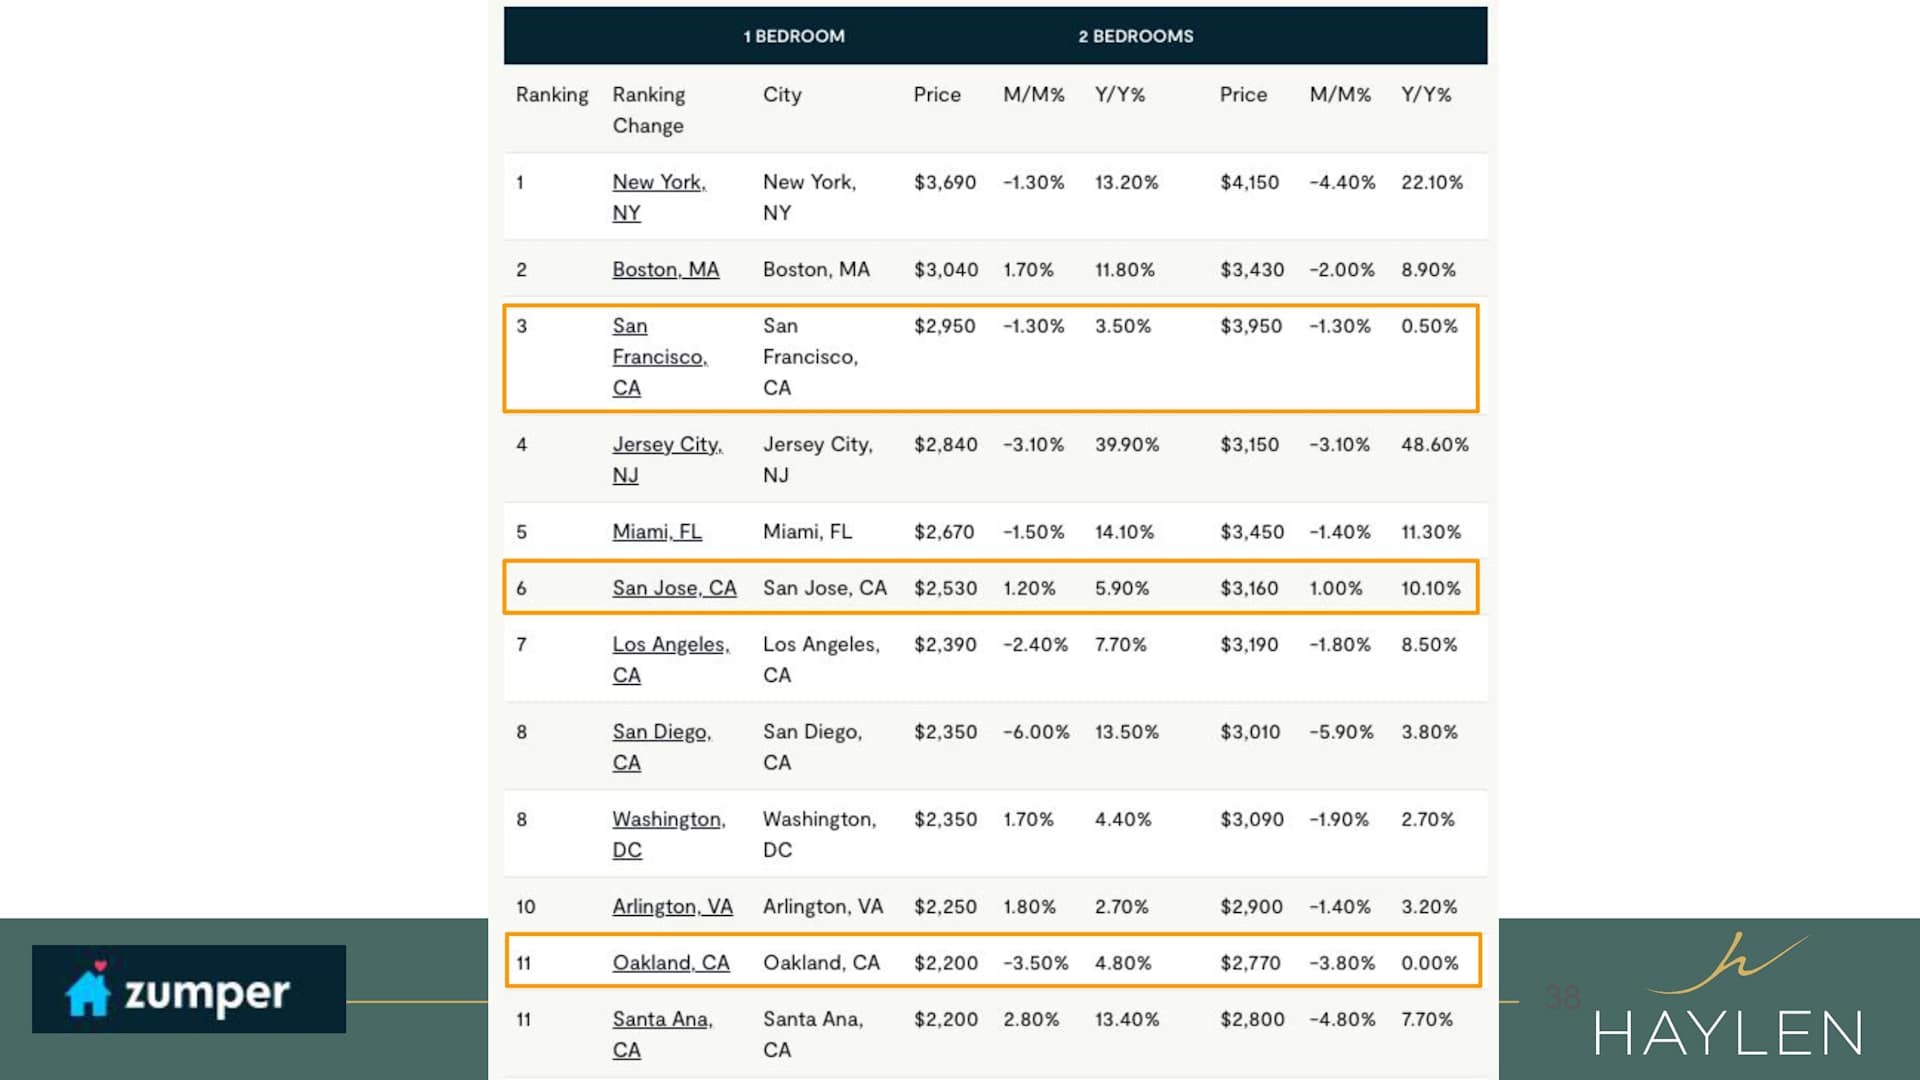
As you see over here San Francisco, San Jose and Oakland, they are still ranking the top 10 in terms of the rental prices in the country.
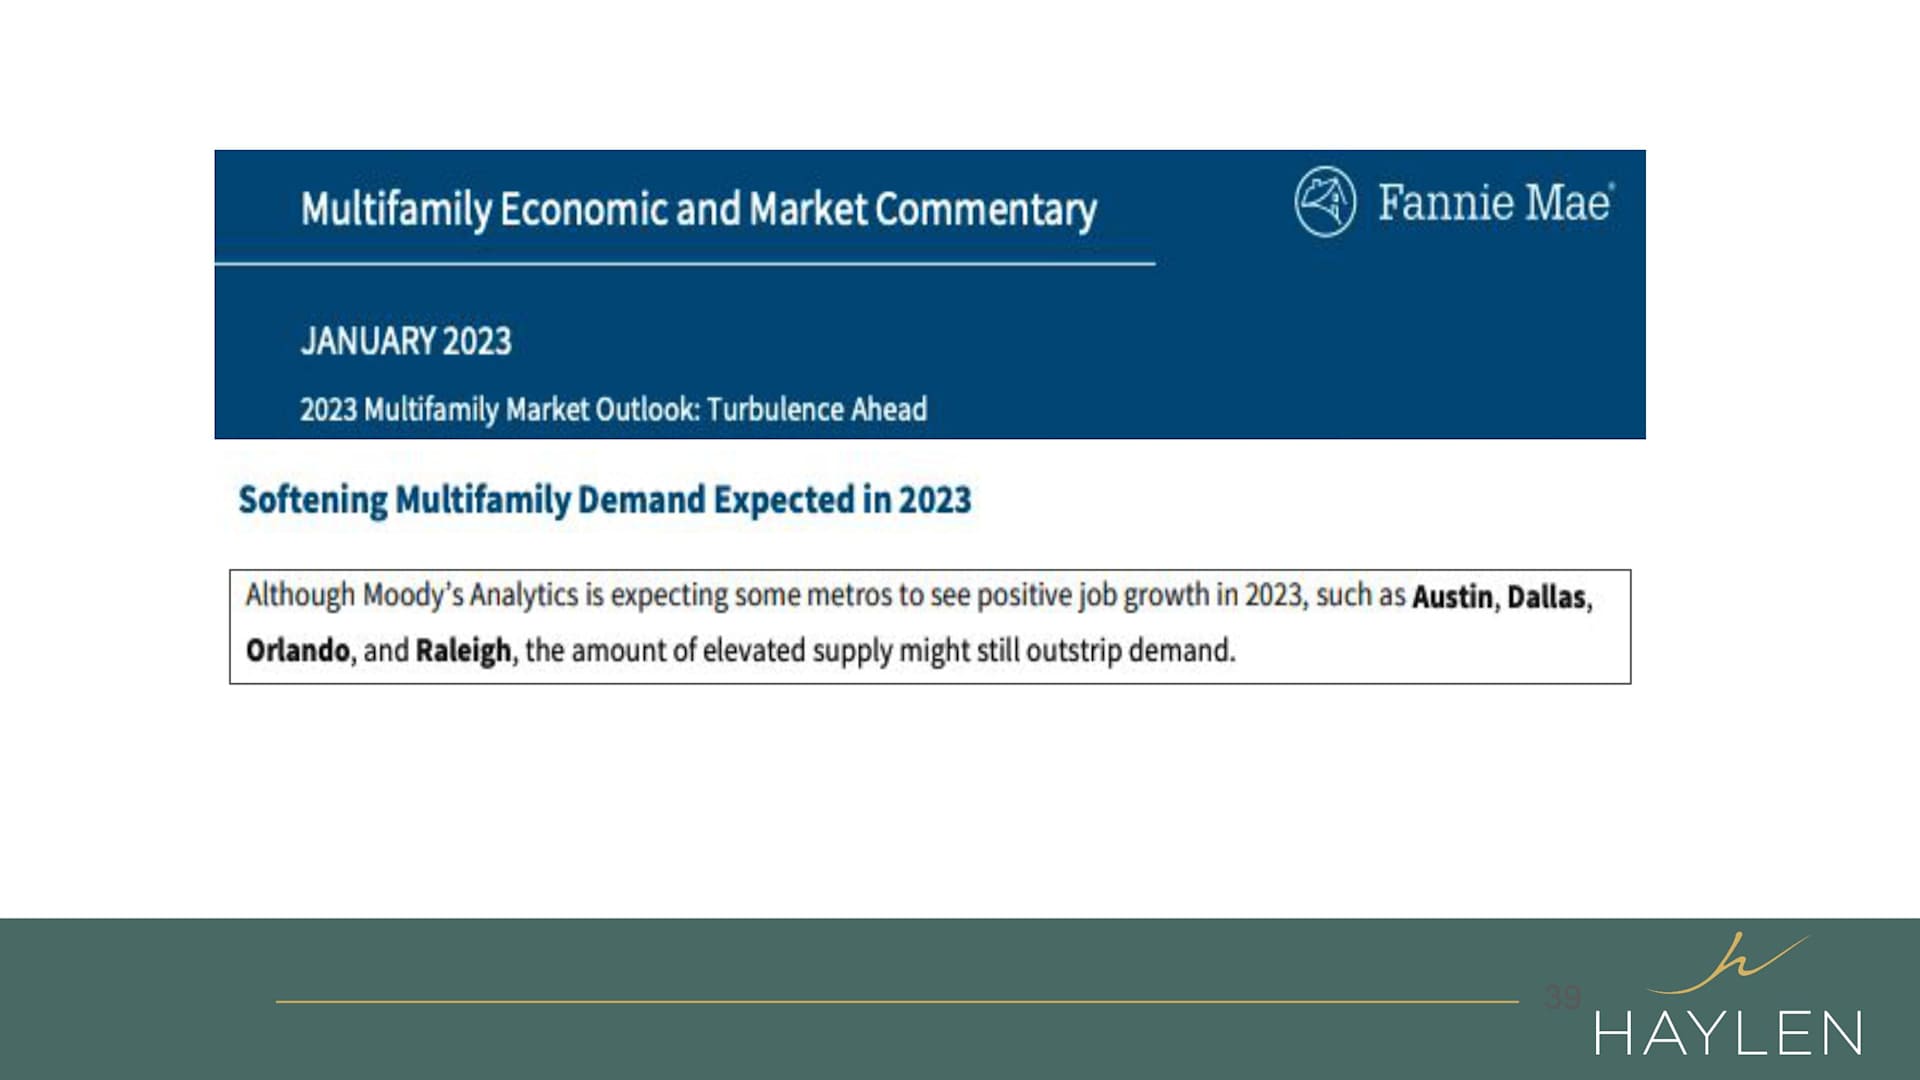
In terms of the demand and supply, we know that in the whole country, we see Austin, Dallas, Orlando and Raleigh, they have the most job growth and they also have a lot of building permits. So, they are actually going to have elevated supply and might still actually outstrip demand in those areas.
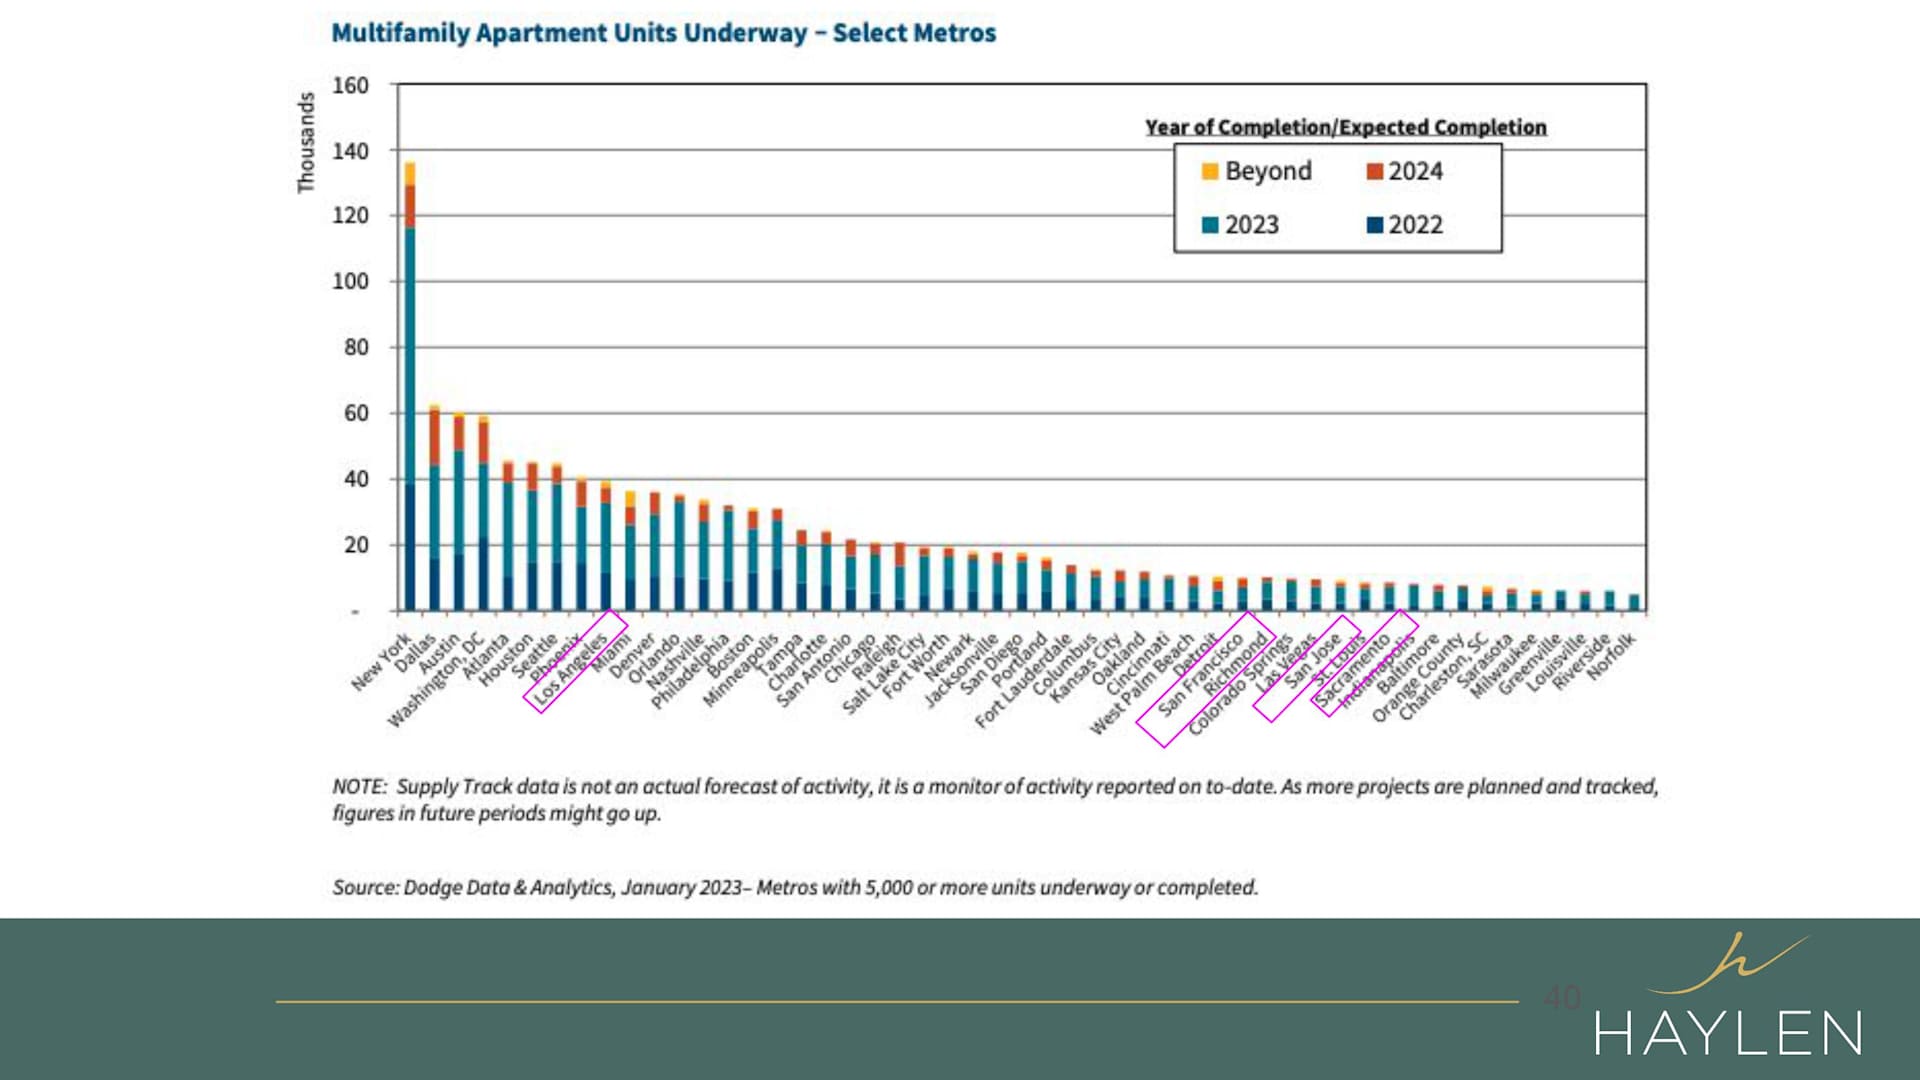
So, if you look at this, it's the multi-family apartment units where they are building and you see that some are highlighted because they are pretty small. In some of the California cities here, building in completion date expected is still very small compared to what they're doing in New York, Dallas, Austin, Washington DC, Atlanta, and Houston, etc. So, we are definitely behind in terms of building. Again, hence we have a much higher demand and not enough supply.
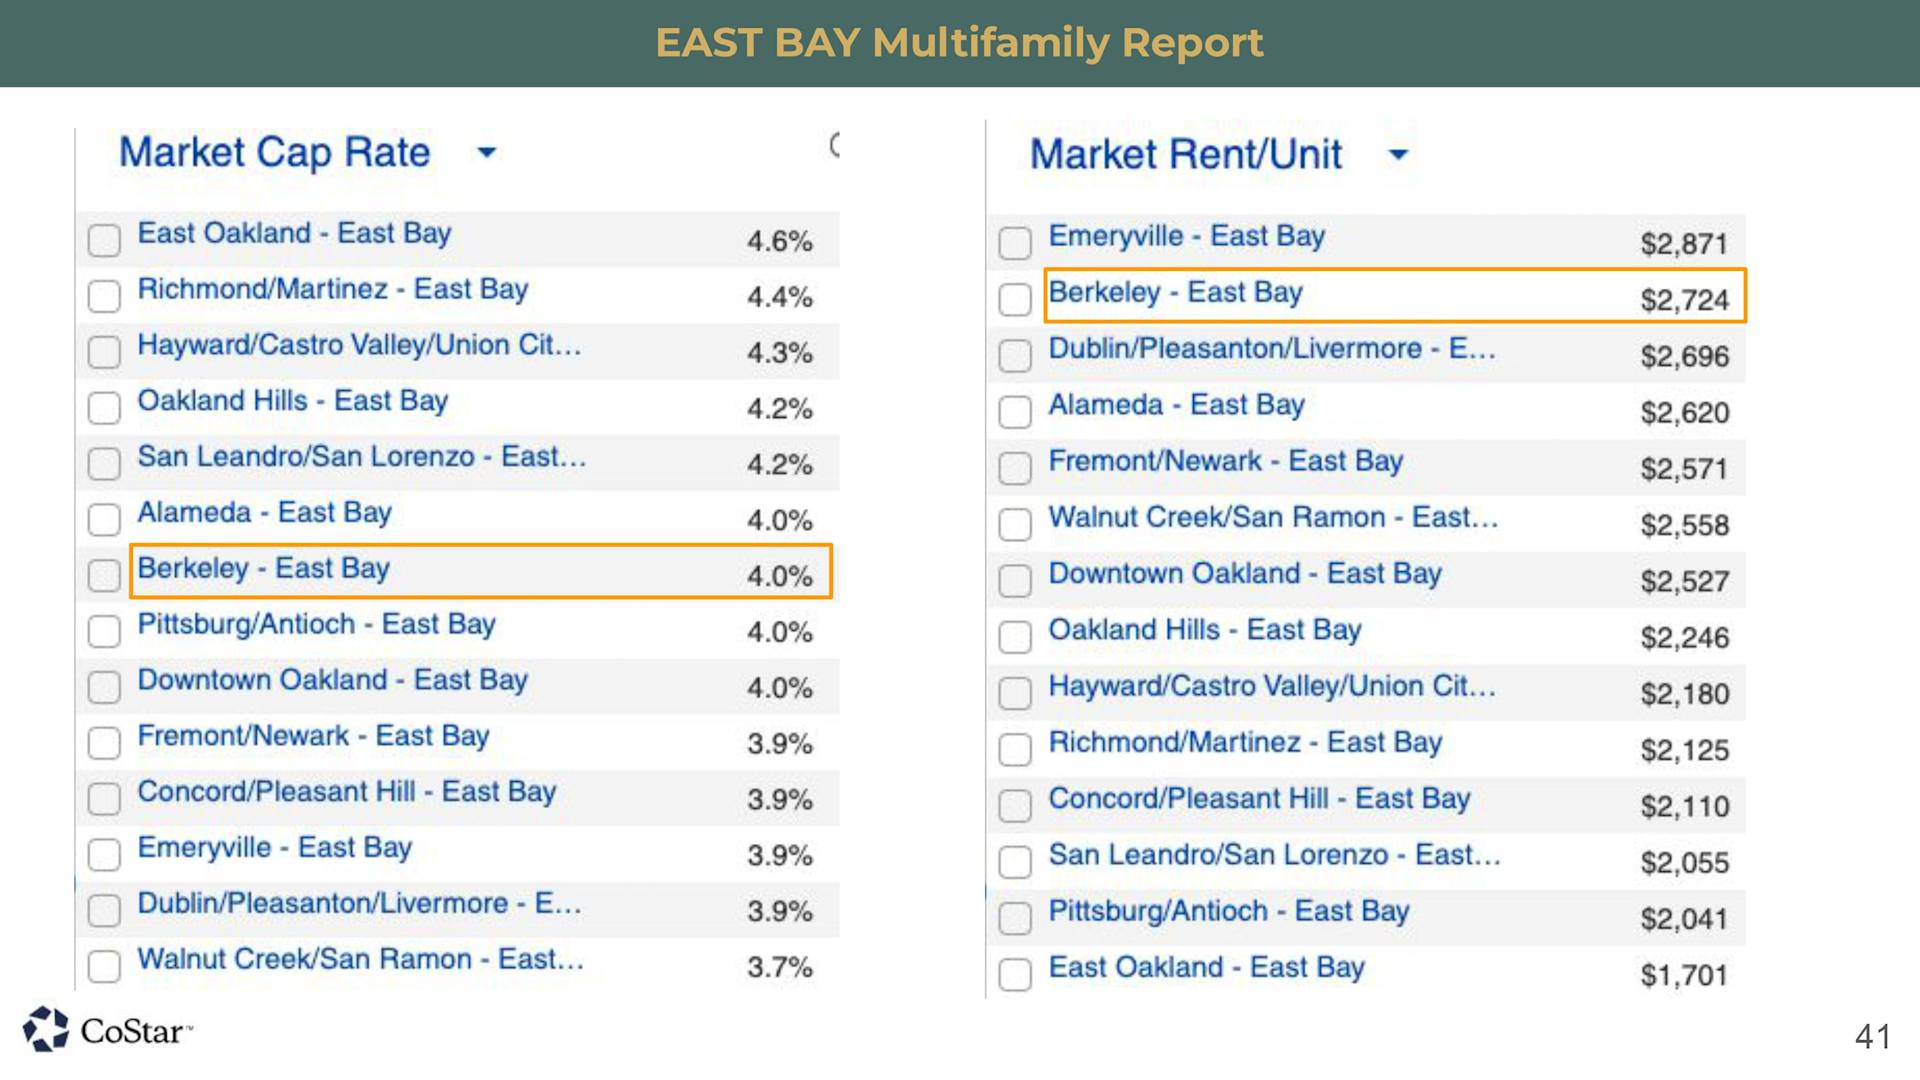
East Bay multi-family report, if you look at the market cap rate in the East Bay, we are ranging around an average of about 4% with East Oakland have the highest cap rate of 4.6% and I highlighted Berkeley because Berkeley has about 4% cap rate but they have a pretty good number in terms of the rental price at %2,724.
Just kind of a side note, is that, the higher the cap rate typically, you'll see that cheaper the property is and cheaper property a lot of times this could be because the rental price is a little bit lower, but in this case, even though Berkeley we have 4% cap, their rental price is one of the highest in the East Bay Area.
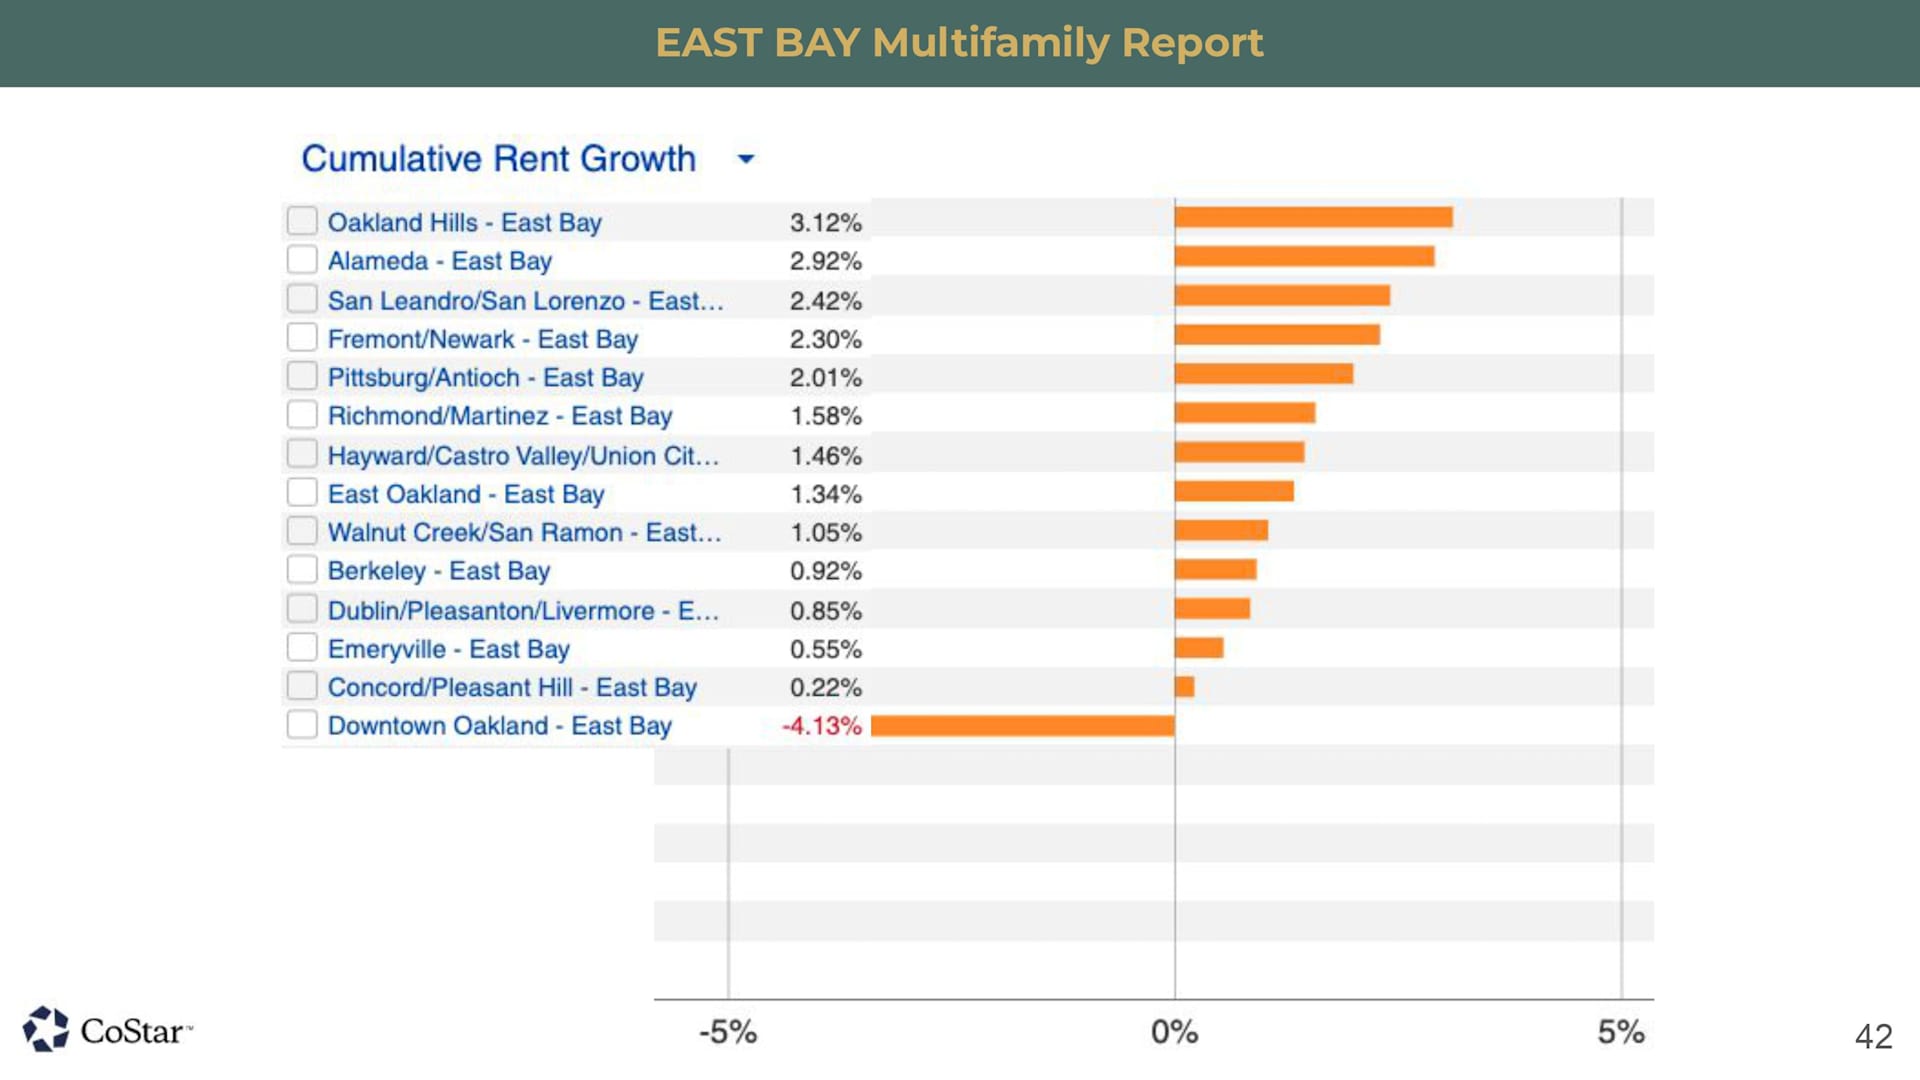
The rent growth also over here, the best rent growth area is in Oakland Hills and second by Alameda and the third is San Leandro.
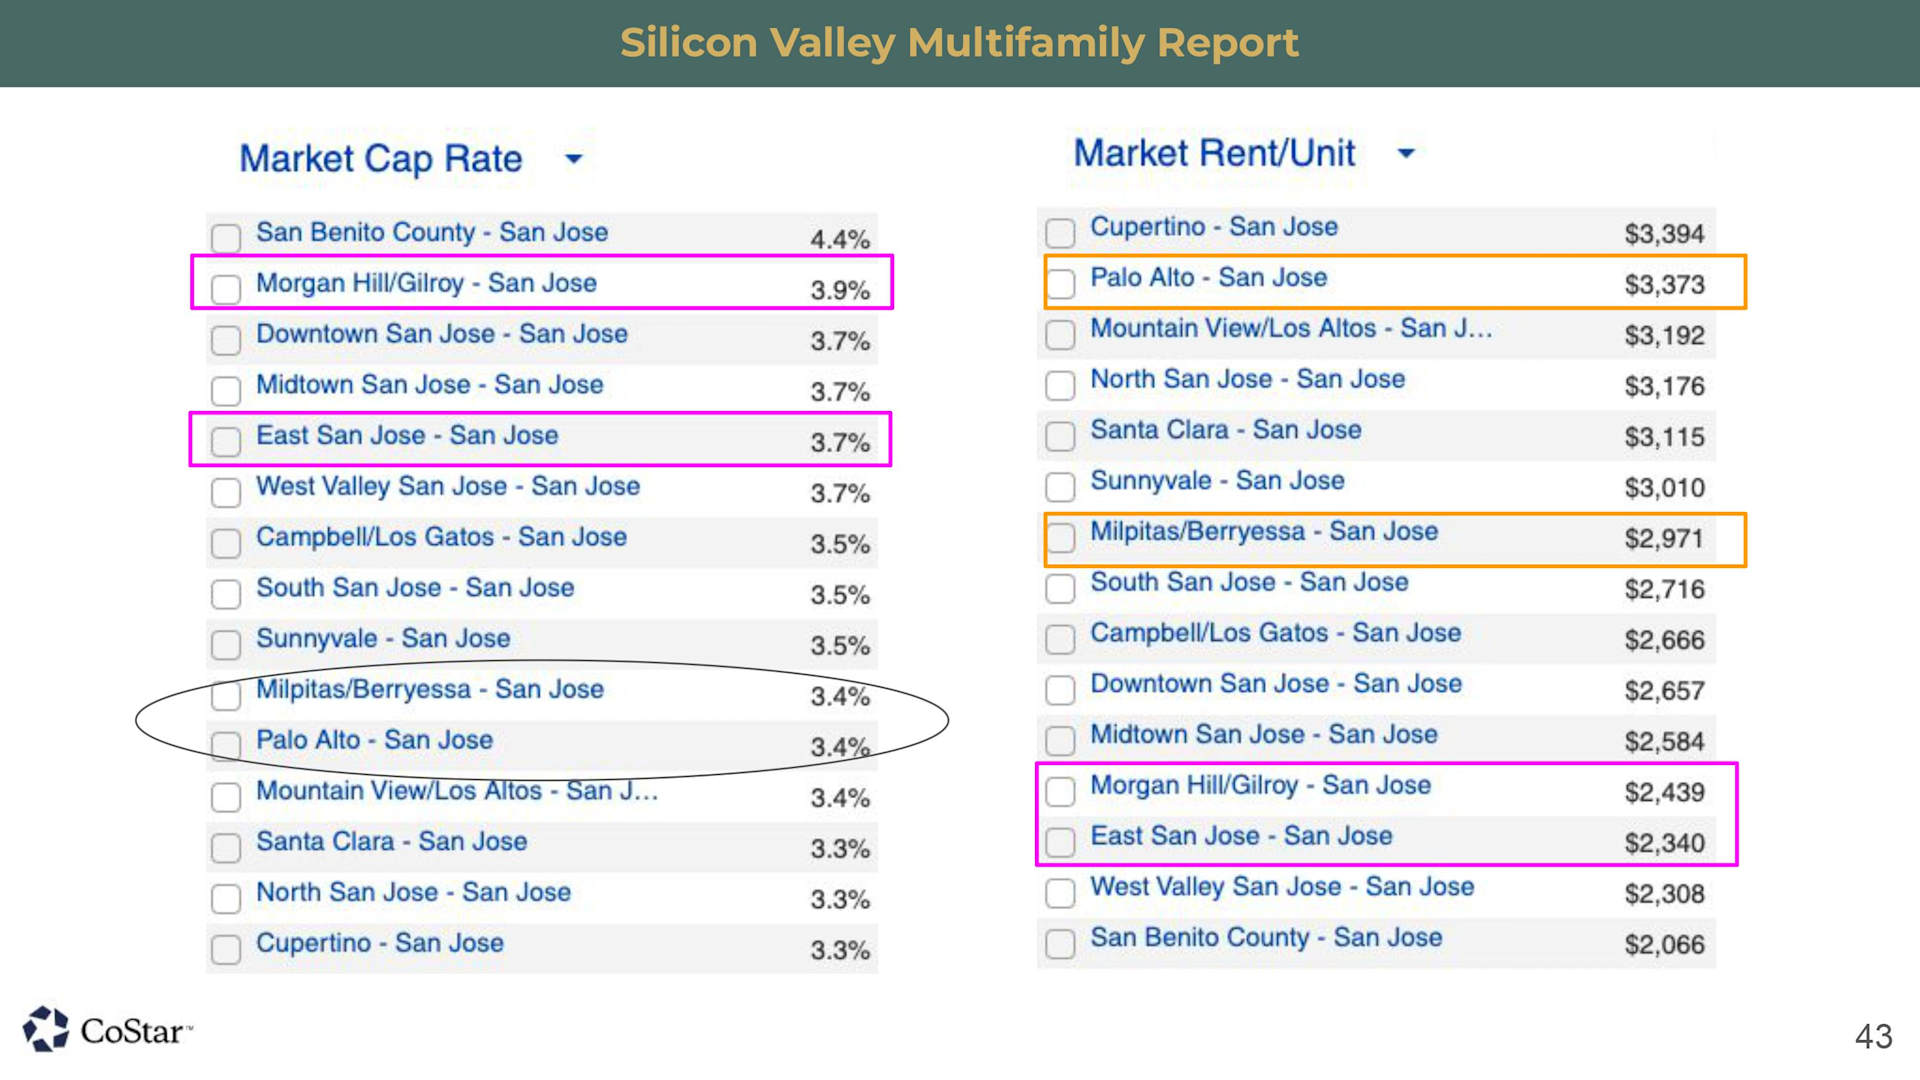
If you look at Silicon Valley multi-family, we're ranging at about mid-three percent on the cap rate and then the Milpitas and Palo Alto, I was so surprised that Milpitas and Palo Alto, they are having a very similar cap rate. But at the same time, Palo Alto their rent price is way above, they are ranking second in terms of our rental price at $3,373 while Milpitas at $2,971. If you look at Morgan Hill/Gilroy is at 2,439 and East San Jose is at 2,340, but Morgan Hill they have a pretty high cap rate at 3.9%, and also East San Jose at 3.7%.
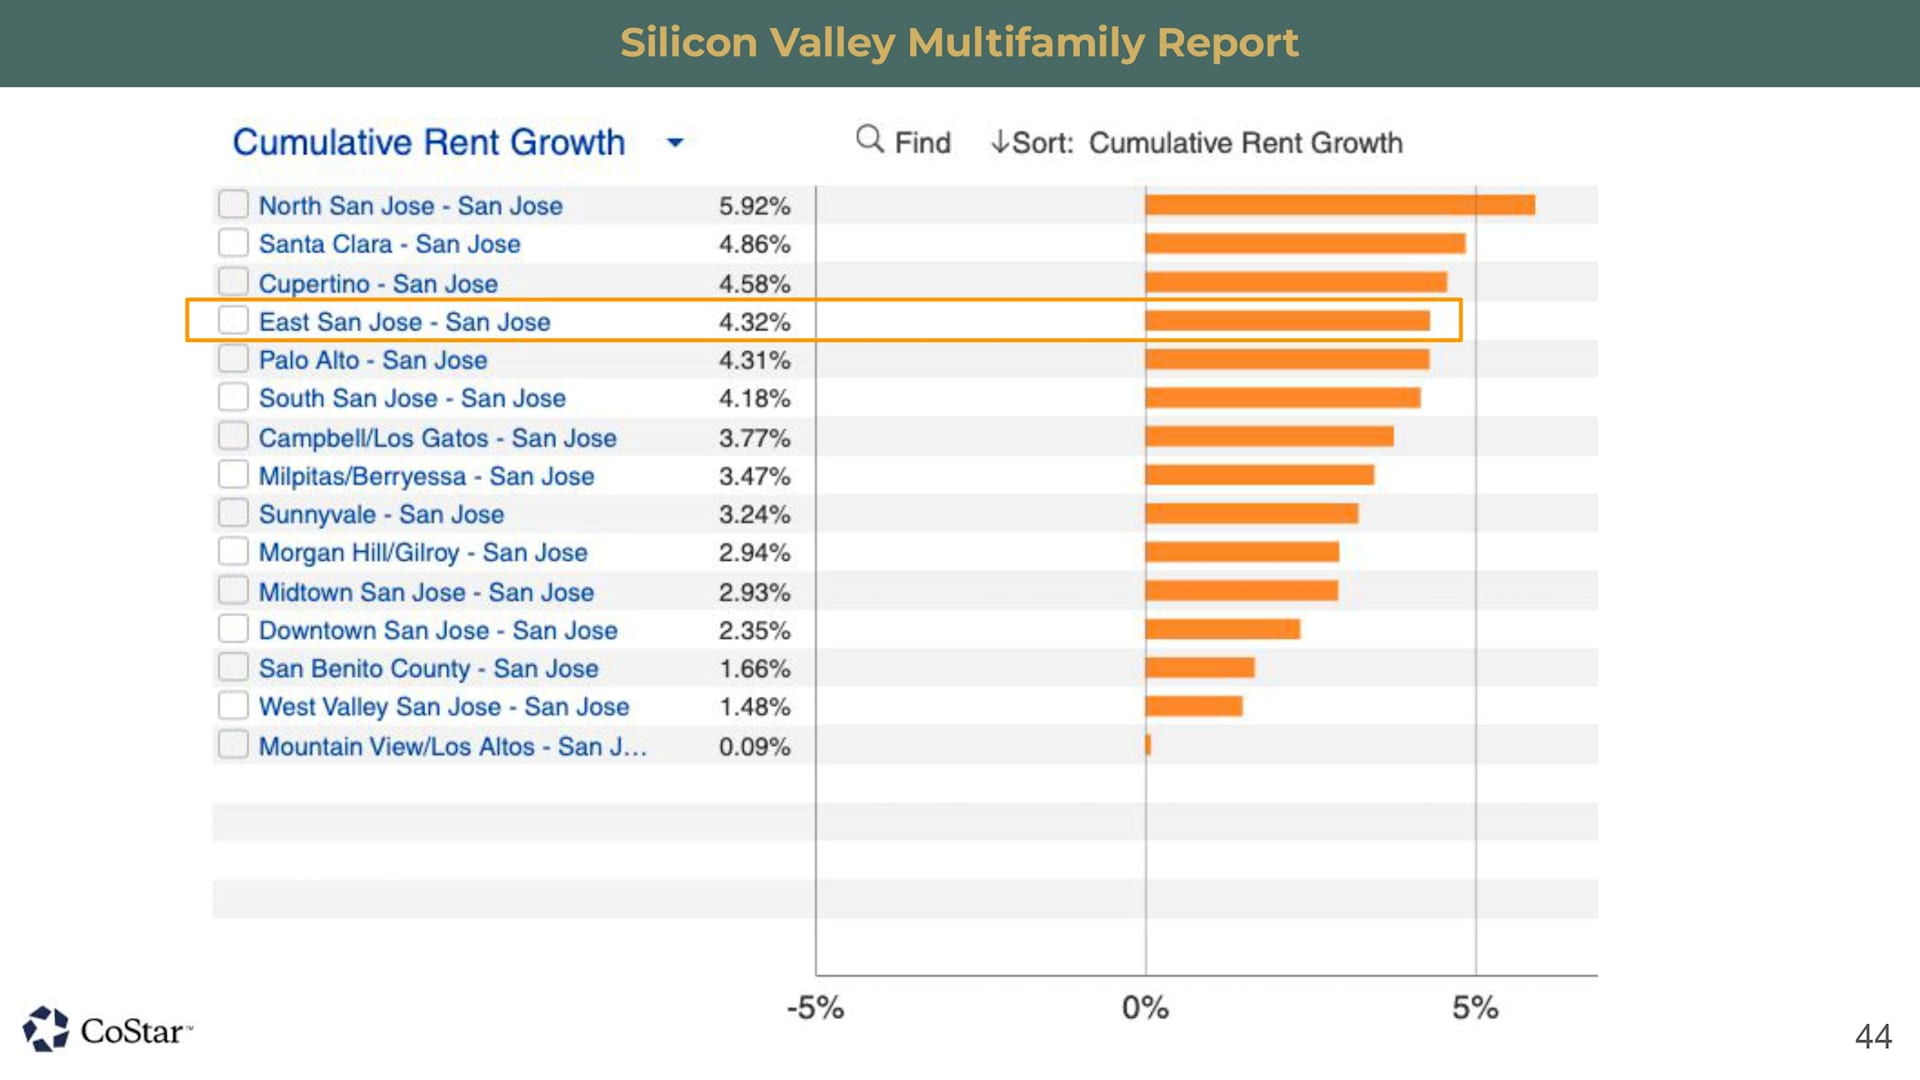
In terms of rent growth, East San Jose has a pretty good rent growth at 4.32% and they also have really good cap rates, so I thought East San Jose is actually a really good market in terms of if you're looking to invest.
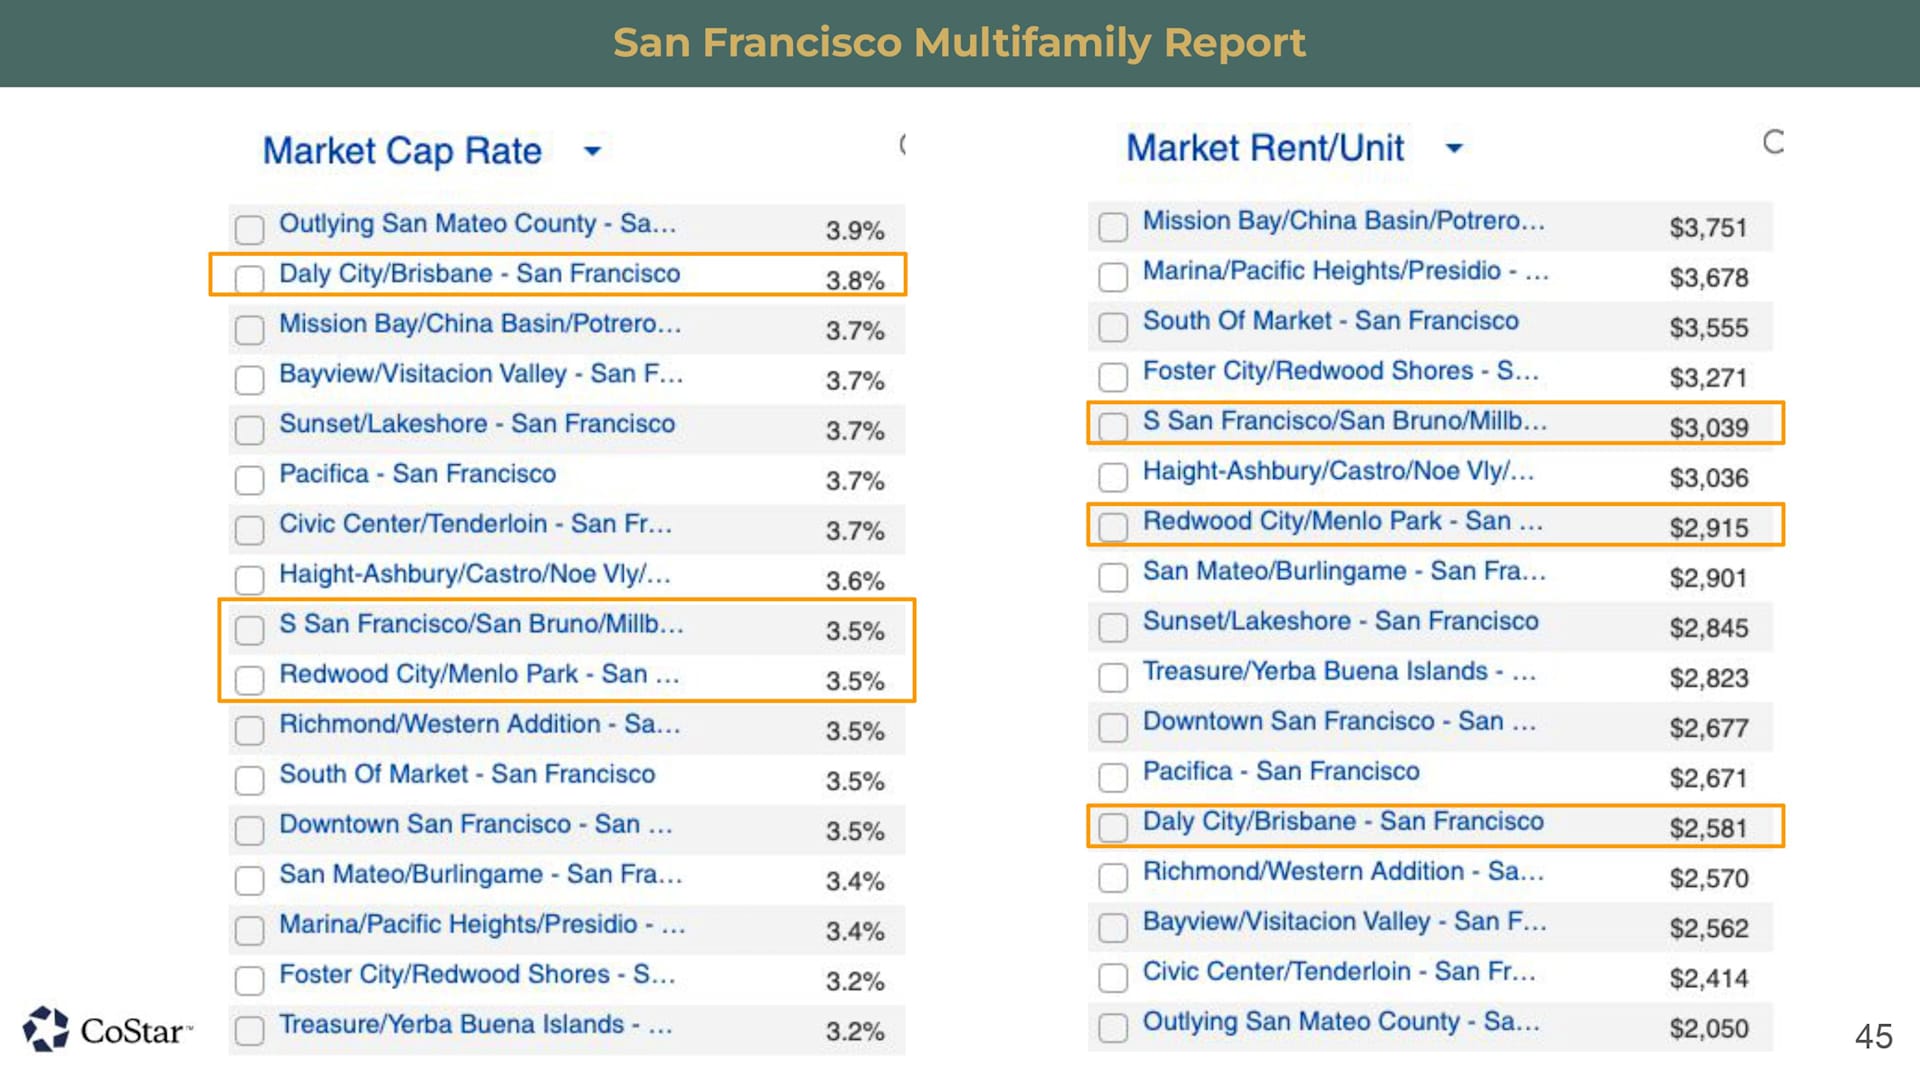
All right, San Francisco Daly City you see that is at 3.8% cap and then their rental price at $2,581 while you see that South San Francisco at 3.5 cap and then their rental price at pretty high is at $3,039 and $2,915 for Redwood City.
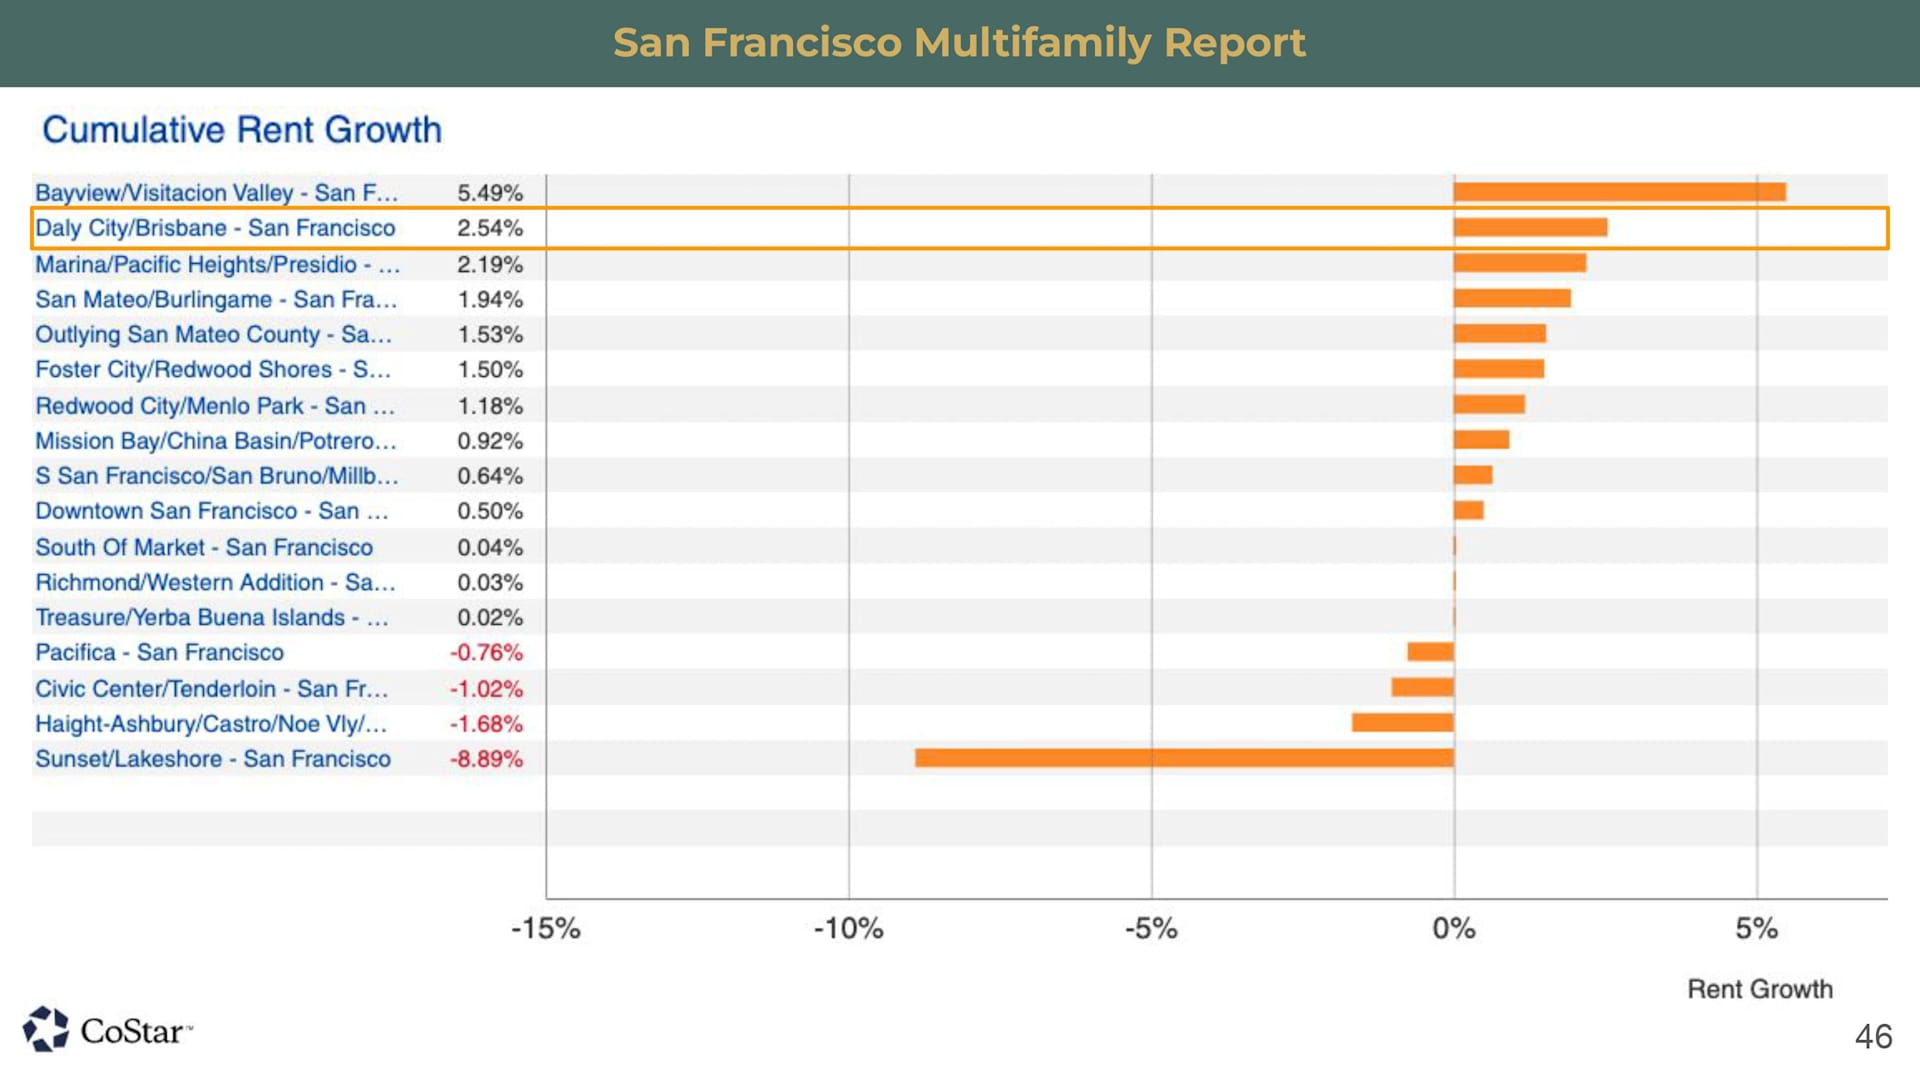
The growth for Daly City is actually ranked two at 2.54% in the San Francisco multi-family market.
So, multi-family demand will continue to be slow in 2023, and this is going to last until 2024. So, if you do want to get a deal this year might be a good time to get a deal on multi-family buildings.
Stay up to date on the latest real estate trends.
A Bay Area Realtor's approach to schools, neighborhoods, and long-term value for families making a move

Part 1 of HAYLEN's series on the 2026 CCIM Spring Forum in Philadelphia
You’ve got questions and we can’t wait to answer them.