March 2023 Newsletter - Silicon Valley Local Lowdown

March 2023 Newsletter - Silicon Valley Local Lowdown

Quick Take:

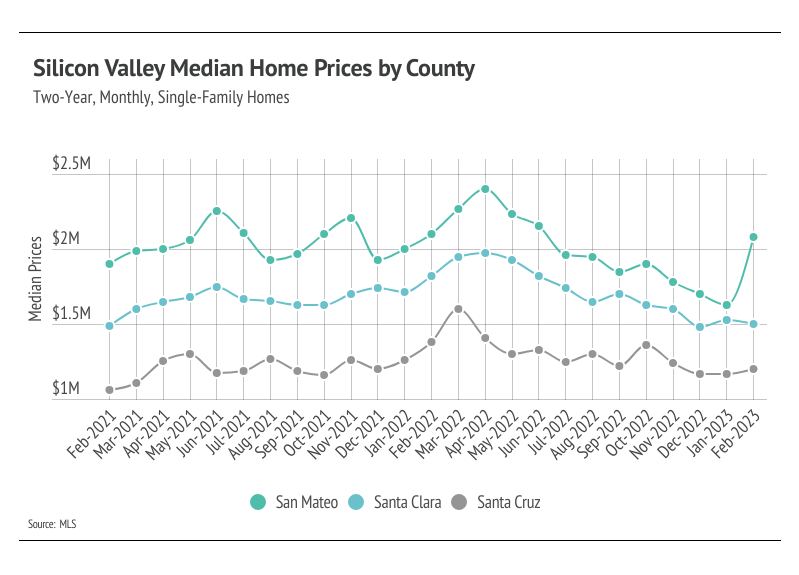
  • Home prices rose significantly in San Mateo month over month after a nine-month contraction, signaling that low inventory and seasonality are still affecting pricing despite higher mortgage rates.
  • Active listings in Silicon Valley rose slightly in February as fewer listings came to market, but inventory is still low relative to demand.
  • Months of Supply Inventory declined as sales increased and homes sold faster month over month, indicating the market has moved deeper into a sellers’ market.
Note: You can find the charts/graphs for the Local Lowdown at the end of this section.
 

Typical and atypical seasonal trends

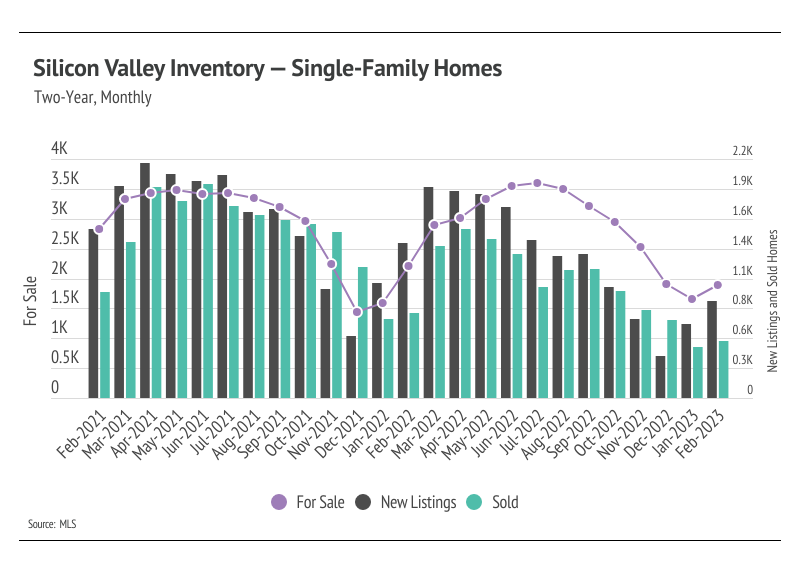
This time of year, we usually see both inventory and sales increasing steadily through mid-summer. Inventory is able to grow, even with rising sales, because of the relatively high number of new listings that typically come to market in the first half of the year. However, the number of new listings in January and February hasn’t outpaced sales enough to significantly increase active listings, which is an early sign that inventory will struggle to grow this year. Although we expect sales to be more muted in 2023, demand is already significantly outpacing supply.
 
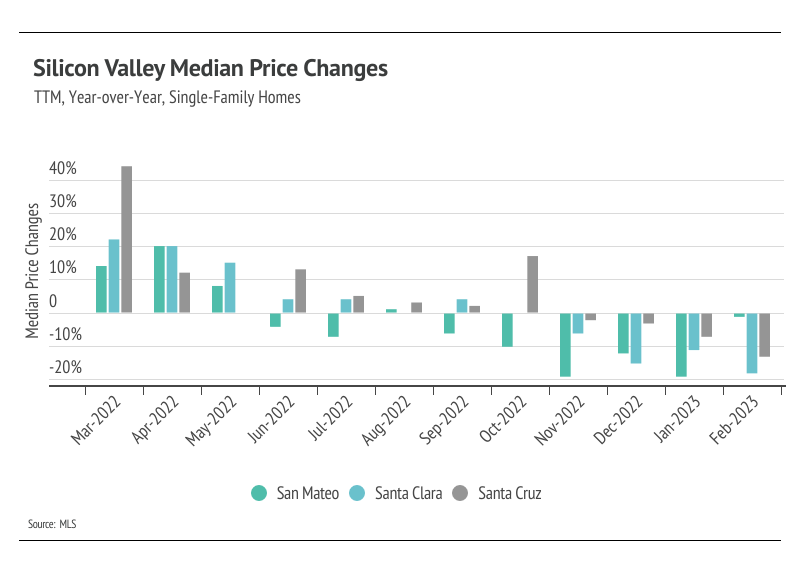
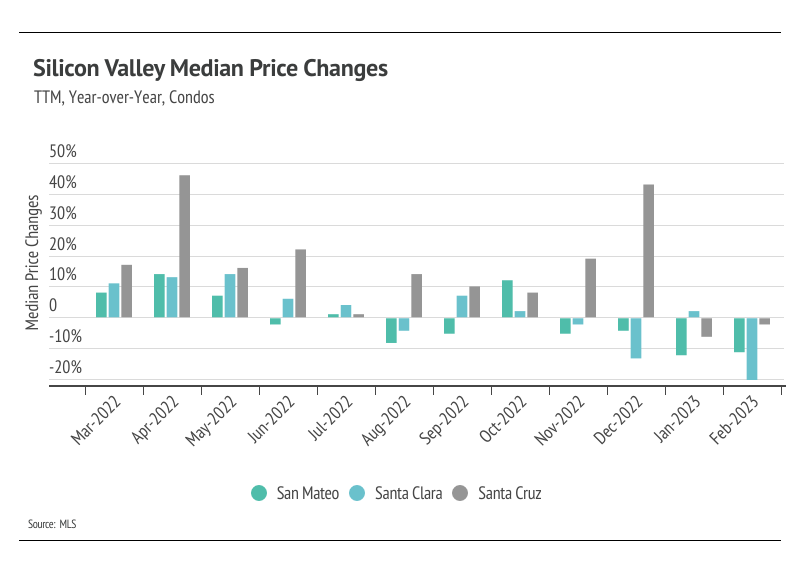
Silicon Valley real estate has proven to be incredibly resilient, especially considering it’s one of the most expensive markets in the country. Single-family home prices rose across Silicon Valley over the past two years, up 9.5% in San Mateo, 1% in Santa Clara, and 13.5% in Santa Cruz. Condo prices were a little more mixed with prices in San Mateo and Santa Clara up 10.5% and 13.3%, respectively, while condo prices in Santa Cruz declined 6.8%. The next three months will give us a clearer picture of how buyers and sellers are reacting to the current market conditions, but early signs point to more competition over the limited number of listings in Silicon Valley as we enter the spring season.
 

Inventory low relative to demand

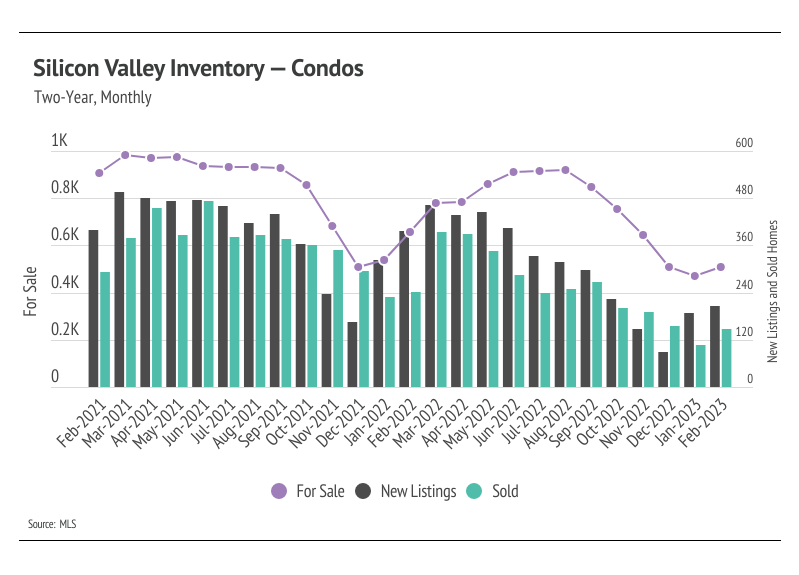
Single-family home and condo inventory rose slightly month over month, as new listings outpaced sales, but far fewer listings came to market than is typical this time of year. Higher interest rates have dropped incentives for potential sellers to enter the market, since sellers usually also must buy a new home. Homeowners either bought or refinanced recently, locking in a historically low rate, which means they aren’t selling and fewer listings are coming to market. Moreover, many potential buyers were priced out of the market as interest rates rose; however, interest rates have been higher for enough time that buyers are more comfortable re-entering desirable markets like Silicon Valley. Currently, buyers aren’t facing anything similar to the hypercompetitive 2021 market, but we will likely start to see more competition among buyers in the spring. New listings fell by 39.8% year over year, while sales declined 34.7%. We still expect some inventory growth in the first half of the year, but inventory will likely remain low.
 

Months of Supply Inventory dropped, indicating a sellers’ market

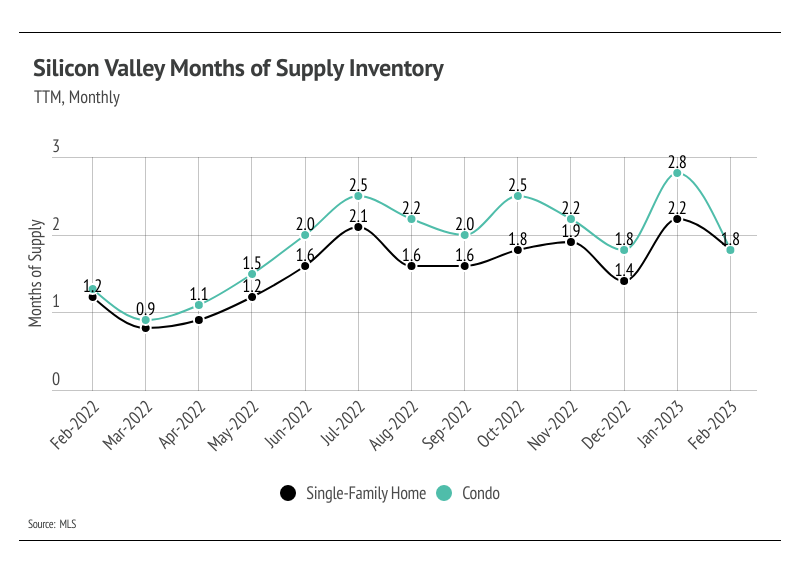
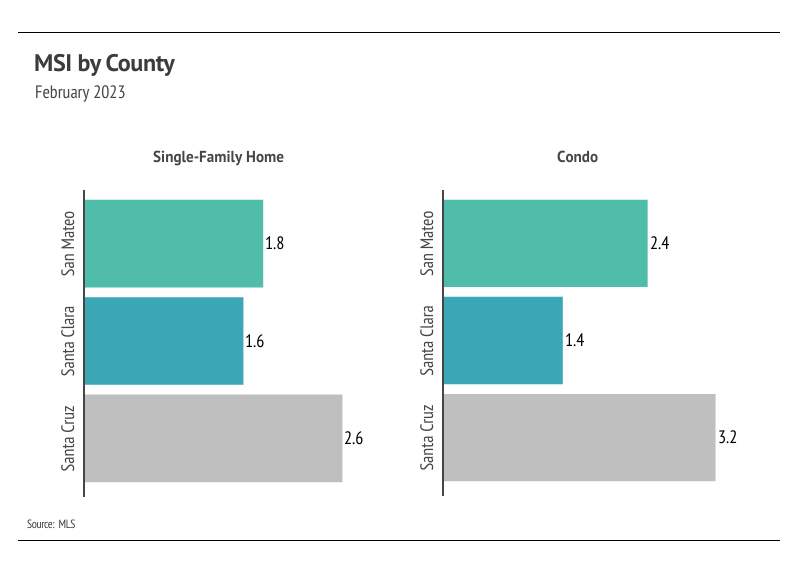
Months of Supply Inventory (MSI) quantifies the supply/demand relationship by measuring how many months it would take for all current homes listed on the market to sell at the current rate of sales. The long-term average MSI is around three months in California, which indicates a balanced market. An MSI lower than three indicates that there are more buyers than sellers on the market (meaning it’s a sellers’ market), while a higher MSI indicates there are more sellers than buyers (meaning it’s a buyers’ market). MSI in Silicon Valley already indicated a sellers’ market, but dropped lower in February for both single-family homes and condos. The sharp drop in MSI occurred due to more sales and homes selling more quickly.
 

Local Lowdown Data

Line chart comparing monthly single-family home prices in San Mateo, Santa Clara, and Santa Cruz counties, February 2021–February 2023.

Chart of year-over-year Silicon Valley single-family home median price changes by county, March 2022 to February 2023.

Line chart of monthly Silicon Valley condo prices by county, February 2021 to February 2023.

Chart comparing year-over-year condo price changes in San Mateo, Santa Clara, and Santa Cruz.

Silicon Valley single-family home market chart tracking monthly inventory, new listings, and sales from February 2021 to February 2023.

Chart of Silicon Valley condo inventory, new listings, and sales by month from February 2021 to February 2023.

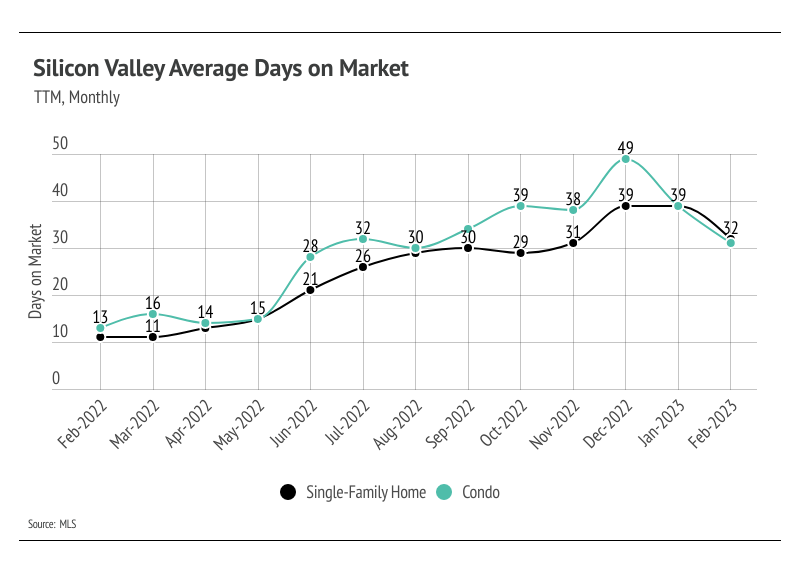
Silicon Valley monthly days on market for condos and single-family homes, February 2022–February 2023.

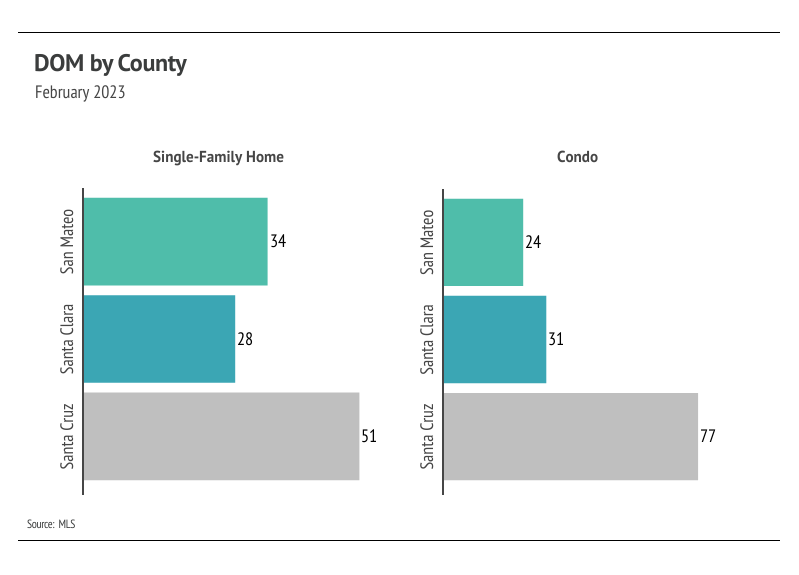
February 2023 days on market by county: single-family homes and condos, shown in a horizontal bar chart.

Line chart comparing Silicon Valley single-family home and condo months of supply, February 2022–February 2023.

February 2023 MSI by county: single-family homes—San Mateo 1.8, Santa Clara 1.6, Santa Cruz 2.6; condos—2.4, 1.4, 3.2.

Our team is committed to continuing to serve all your real estate needs while incorporating safety protocol to protect all of our loved ones.
 
In addition, as your local real estate experts, we feel it’s our duty to give you, our valued client, all the information you need to better understand our local real estate market. Whether you’re buying or selling, we want to make sure you have the best, most pertinent information, so we put together this monthly analysis breaking down specifics about the market.
 
As we all navigate this together, please don’t hesitate to reach out to us with any questions or concerns. We’re here to support you.

Let's Talk

You’ve got questions and we can’t wait to answer them.
Follow Us on Instagram