Quick Take:
- Home prices in Silicon Valley remained historically high in April; short-term demand boomed as buyers tried to lock in lower mortgage rates.
- The second quarter of 2022 will indicate whether the market is moving toward or away from normalization. April data show the number of new listings declined, signaling potential supply issues in the spring and summer seasons.
- Despite some minor softening of demand as rates increase, low housing supply will continue to drive prices up unless an unexpected number of new listings come to market.
Note: You can find the charts/graphs for the Local Lowdown at the end of this section.
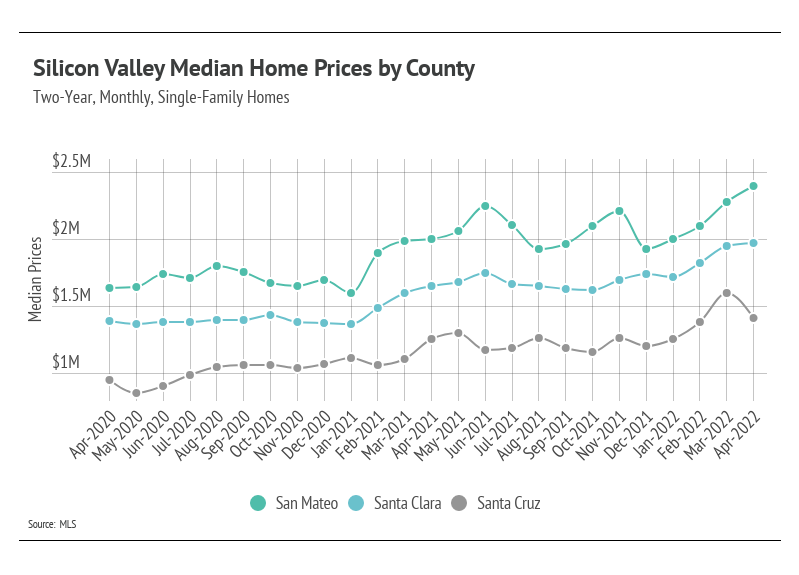
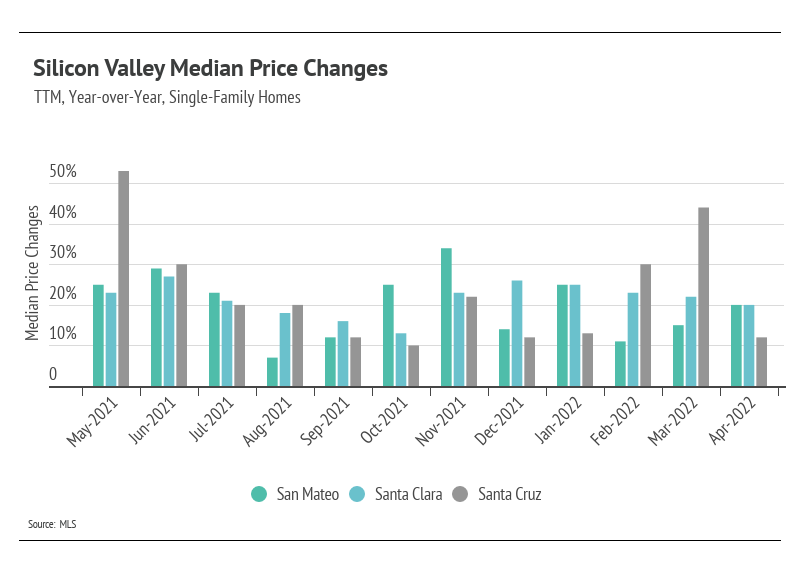
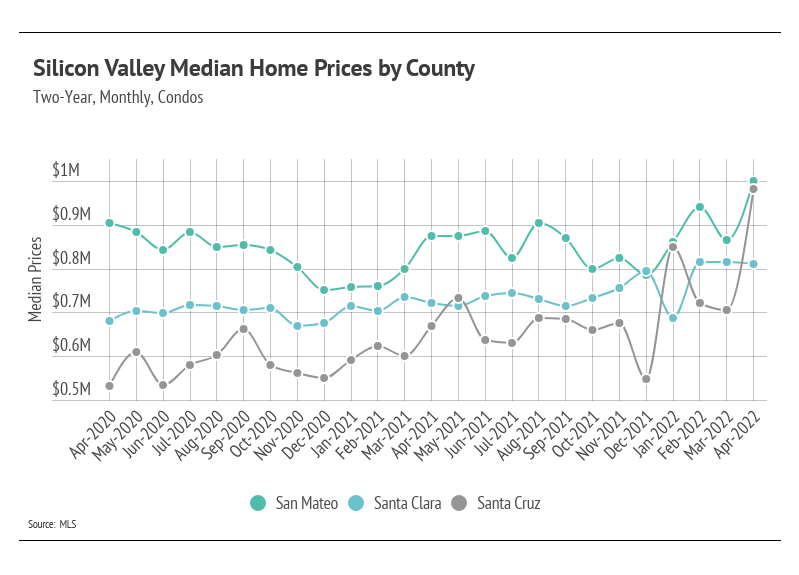
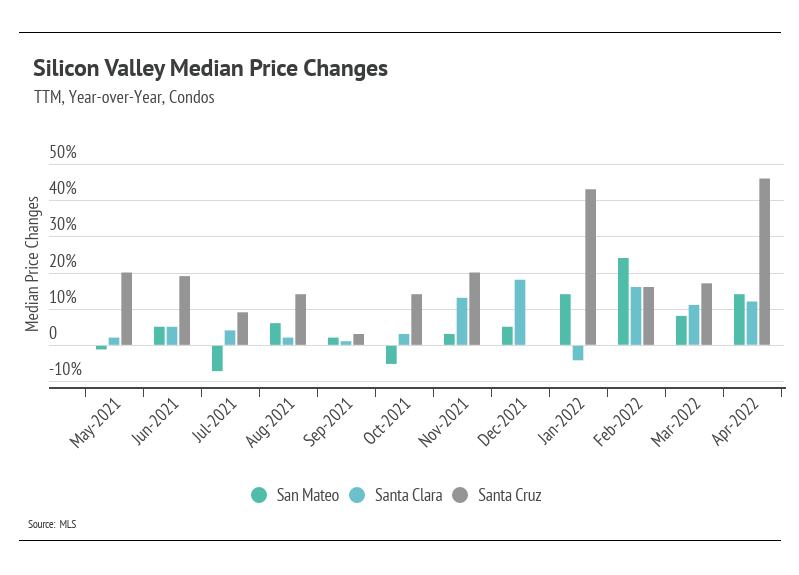
Home prices continue to rise despite rising rates
Single-family home and condo prices rose to all-time highs in April 2022 across much of the Silicon Valley region. It’s still too early, however, to determine how increasing rates will affect the market. Mortgage rate hikes only lower demand in the long term. In the short term, demand increases as buyers try to lock in lower rates. Over the past four months, the average 30-year mortgage rate has increased 2%, which means a 27% increase in monthly mortgage payments, yet prices keep moving higher.
The factors now affecting home prices are anticipated to have mixed results, unlike the past two years when all factors caused prices to increase. Rising interest rates, which will hopefully curb the rising 40-year-high inflation rate, will make homes less affordable and dampen demand over the rest of the year. They may, however, also lower supply as current homeowners reconsider their plans to sell.
Many homebuyers are also home sellers, moving from one home to another. Newer homebuyers and homeowners who refinanced over the past two years locked in one of the lowest rates in history, making moving a more difficult financial decision. This could keep supply unseasonably low with fewer new listings coming to market, as we saw in April. In general, the Fed doesn’t have a tool to deal with supply-side issues: It uses monetary policy to affect demand, making money more or less expensive. As a result, the Fed’s rate hikes may result in unintentional effects on supply. In Silicon Valley, the lack of housing supply will keep prices rising in the coming months.
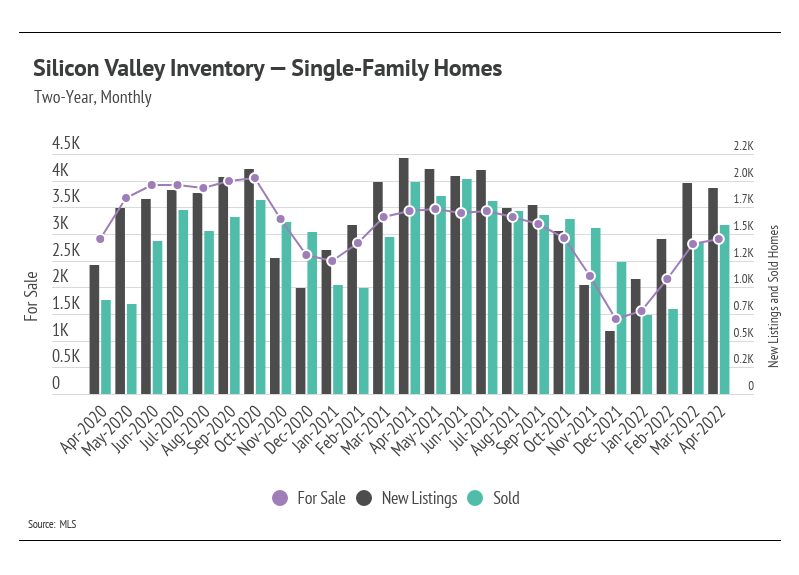
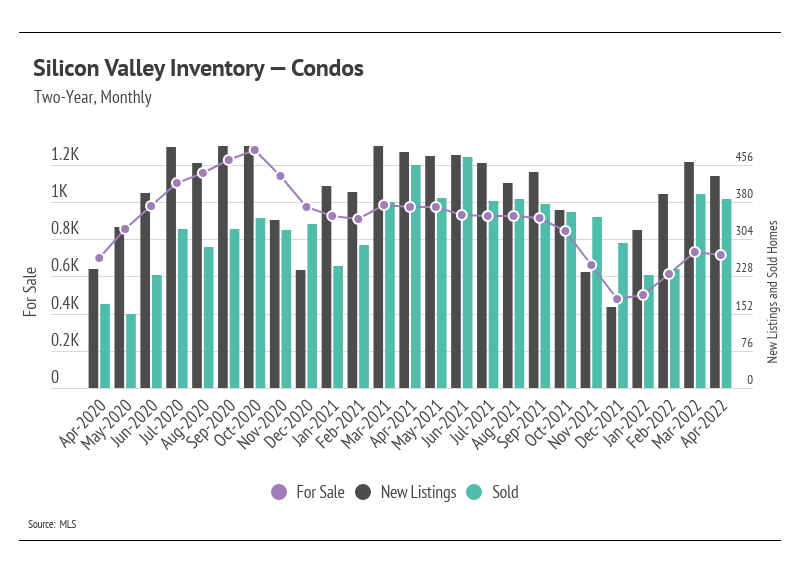
New listings dip, seasonally abnormal
In Silicon Valley, inventory continued to climb higher in April, which is great news for the highly undersupplied market. However, new listings declined slightly from March to April for single-family homes and condos, far from the seasonal norm and an early indicator that home supply will remain depressed this year. The high demand and lack of new listings over the past year brought single-family home and condo supplies to record lows across markets. We were pleased to see that inventory increased over the first four months of the year, a trend that usually holds until mid-summer. The next three months will be telling of how inventory levels will trend for the rest of the year.
Even though inventory is low, sales remain incredibly high, especially when we account for available supply. This trend once again highlights the high demand in the area. Sellers can expect multiple offers, and buyers should come with competitive offers.
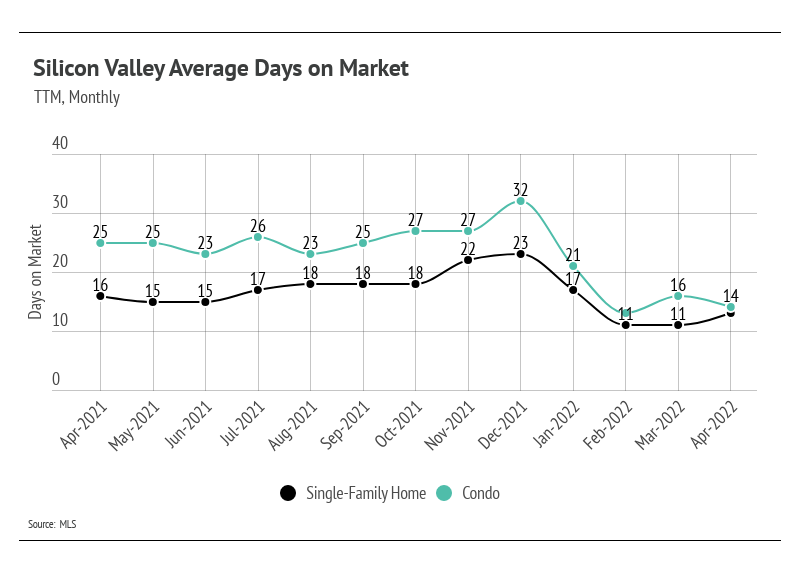
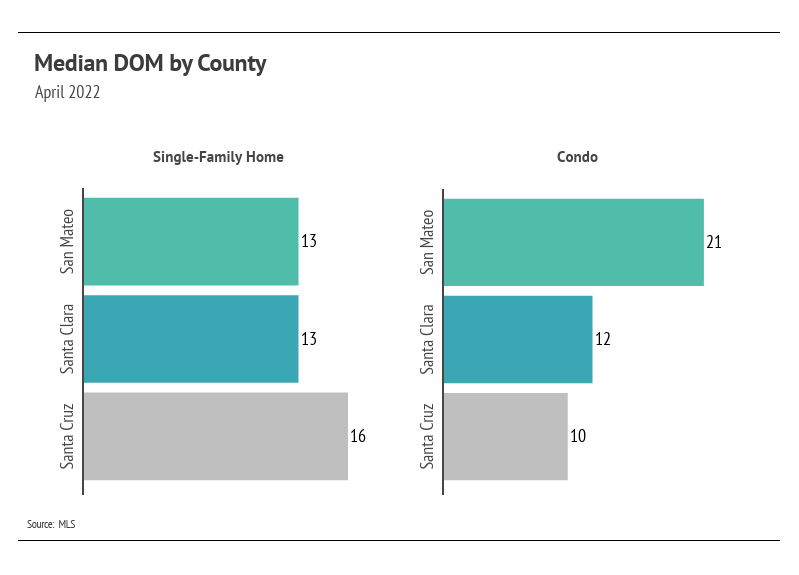
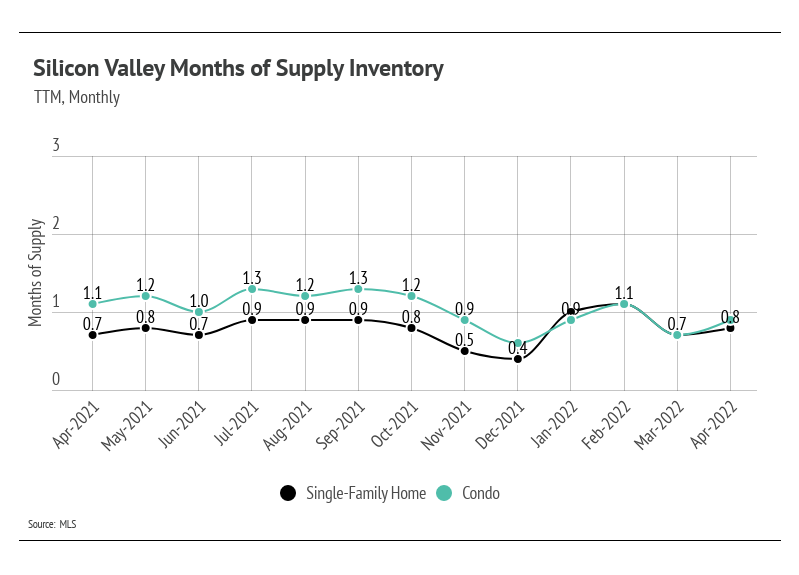
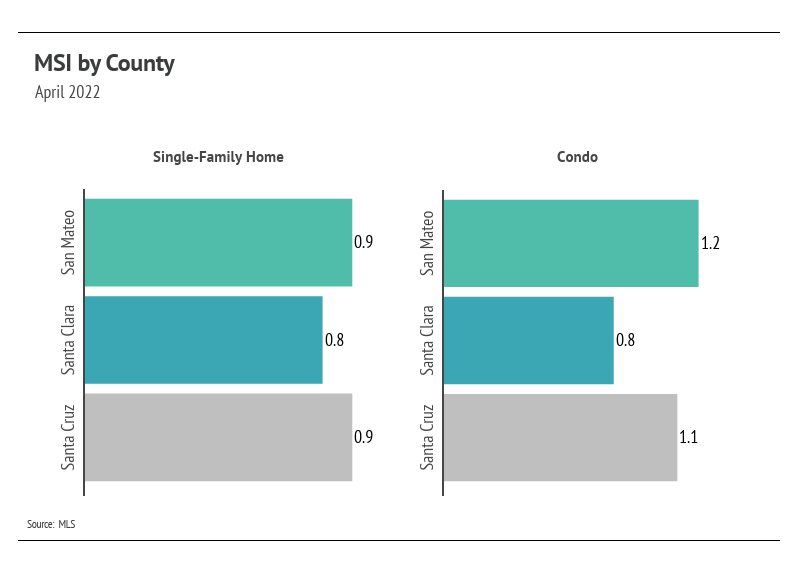
Months of Supply Inventory further indicates high demand relative to supply
Homes are selling faster than ever. Buyers must put in competitive offers, which, on average, are around 13% above list price for single-family homes and 7% above list for condos.
Months of Supply Inventory (MSI) quantifies the supply/demand relationship by measuring how many months it would take for all current homes listed on the market to sell at the current rate of sales. The average MSI is three months in California, which indicates a balanced market. An MSI lower than three indicates that there are more buyers than sellers on the market (meaning it’s a sellers’ market), while a higher MSI indicates there are more sellers than buyers (meaning it’s a buyers’ market). Currently, single-family home and condo MSIs are exceptionally low, indicating a strong sellers’ market.
Local Lowdown Data
Our team is committed to continuing to serve all your real estate needs while incorporating safety protocol to protect all of our loved ones.
In addition, as your local real estate experts, we feel it’s our duty to give you, our valued client, all the information you need to better understand our local real estate market. Whether you’re buying or selling, we want to make sure you have the best, most pertinent information, so we put together this monthly analysis breaking down specifics about the market.
As we all navigate this together, please don’t hesitate to
reach out to us with any questions or concerns. We’re here to support you.