November Newsletter – Silicon Valley Local Lowdown

Quick Take:
Note: You can find the charts/graphs for the Local Lowdown at the end of this section.
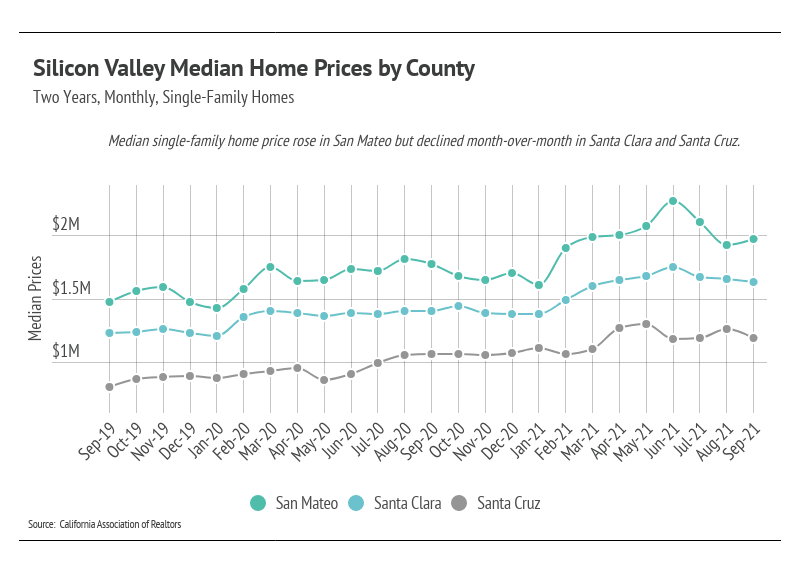
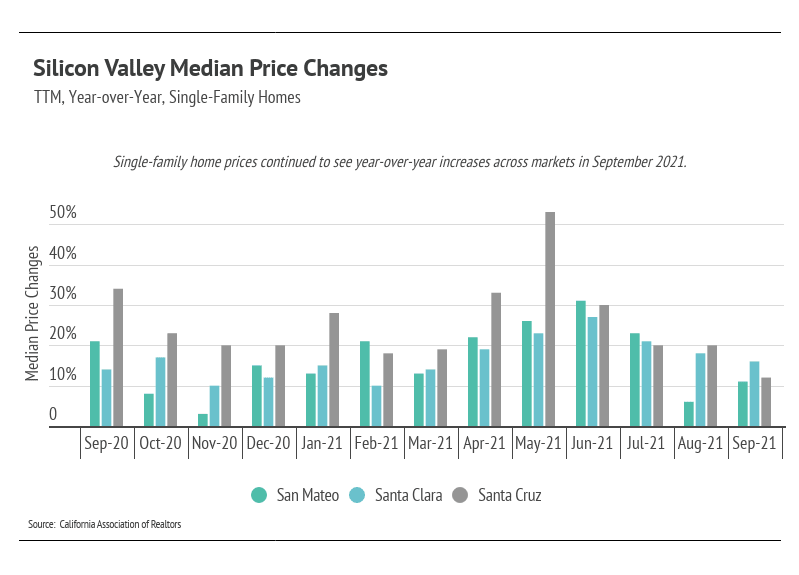
The growth rates in 2021 are highly unusual and unsustainable; for example, home prices would more than double every five years at a 15% growth rate. After huge single-family home price appreciation in the first half of the year, it made sense that prices declined in the third quarter. During the summer months (July–September), San Mateo County home prices declined 13%, up 16% for the year. During the same time period, Santa Clara home prices experienced a less substantial decline: a drop from 27% in June to 19% in September. Santa Cruz gained 1%, bringing the year-to-date price increase to 11%.
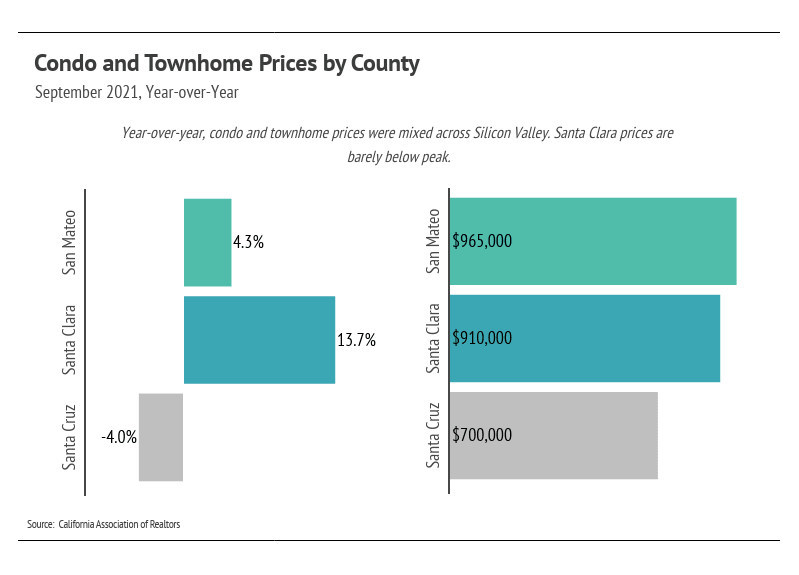
Condo prices are near all-time highs in Silicon Valley. Similar to single-family homes, prices contracted in the third quarter. Although the price appreciation wasn’t as pronounced for condos as it was for single-family homes, the growth rates for condos in 2021 are also unsustainable.
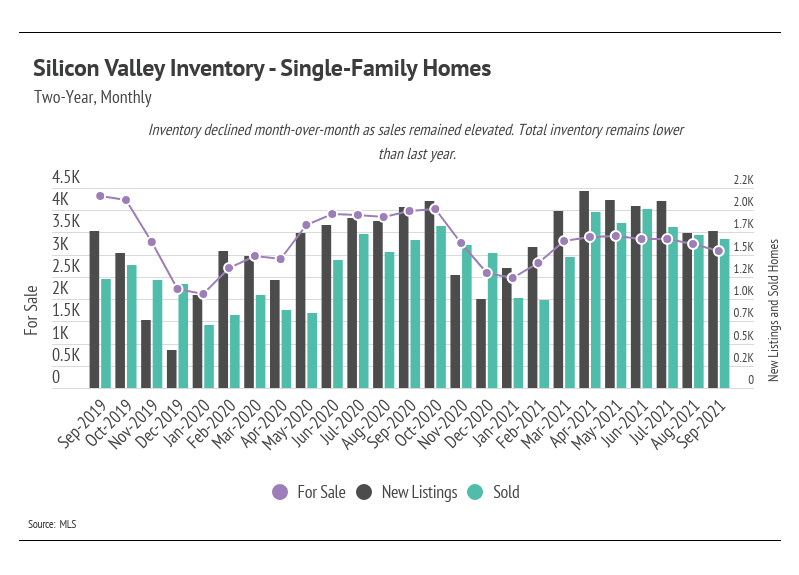
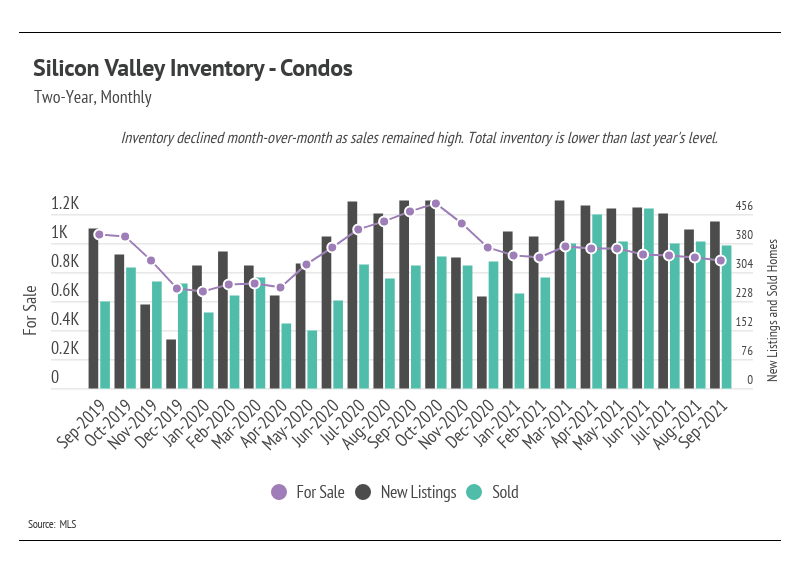
Despite the increase in single-family home inventory in 2021, we’re still at a historic low. August and September are typically the months with the highest inventory every year. In 2021, total inventory didn’t come close to last year’s level and was even further away from pre-pandemic levels. Even though we’re seeing some price correction after the first half of the year, the sustained low inventory will lift prices. Sales in Silicon Valley have been incredibly high, again highlighting demand in the area.
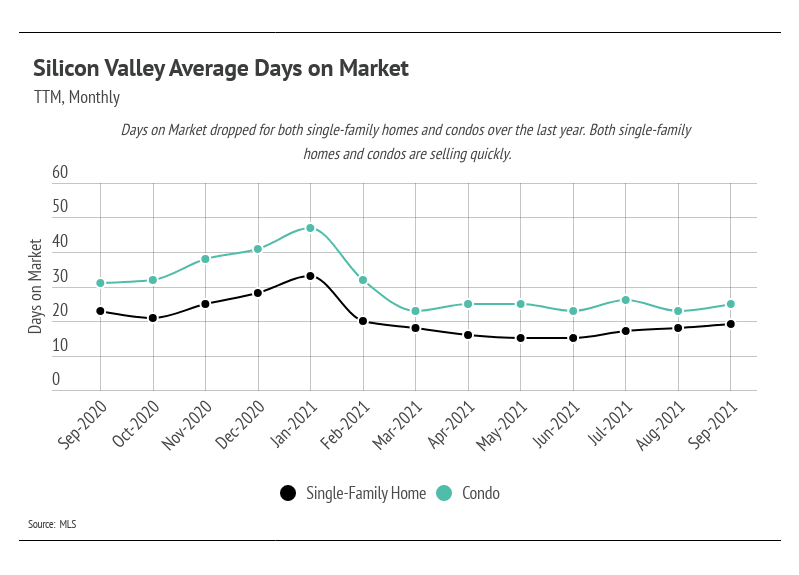
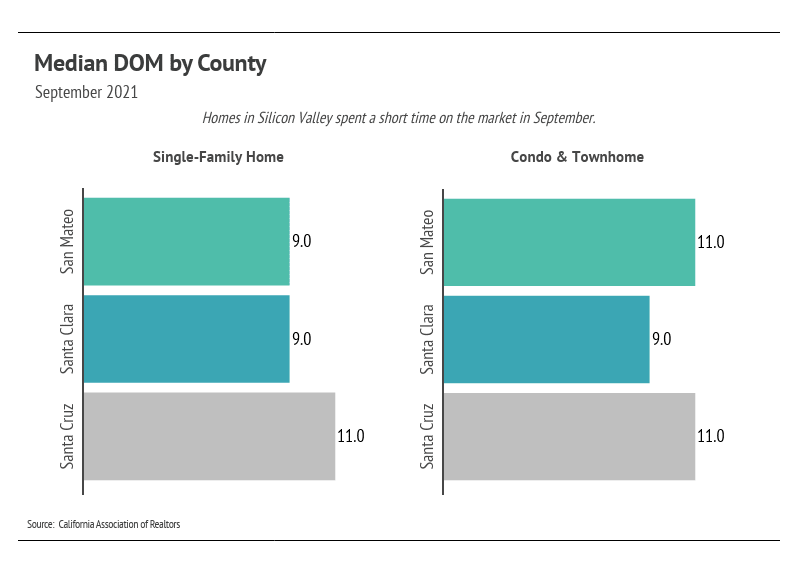
Homes are selling faster than at any point in the last 15 years. The Days on Market reflects the high demand for homes in Silicon Valley. Buyers must put in competitive offers, which, on average, are 1–5% above the list price of the home.
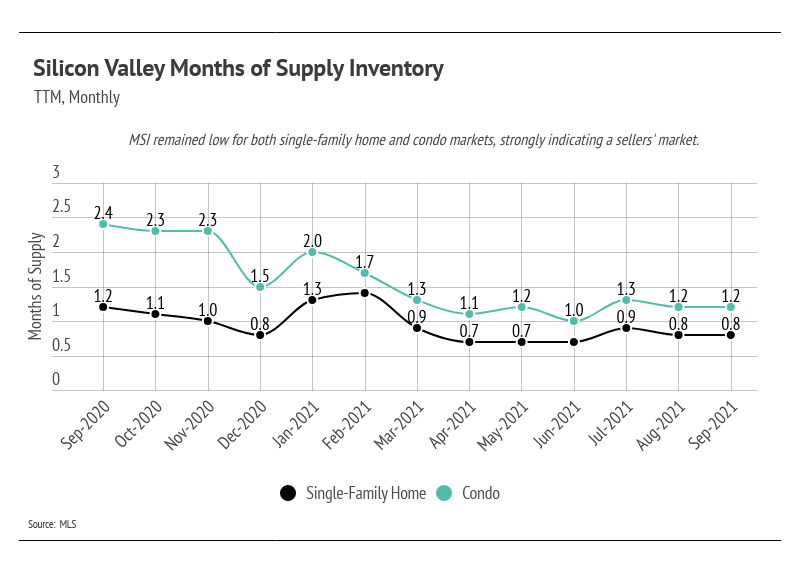
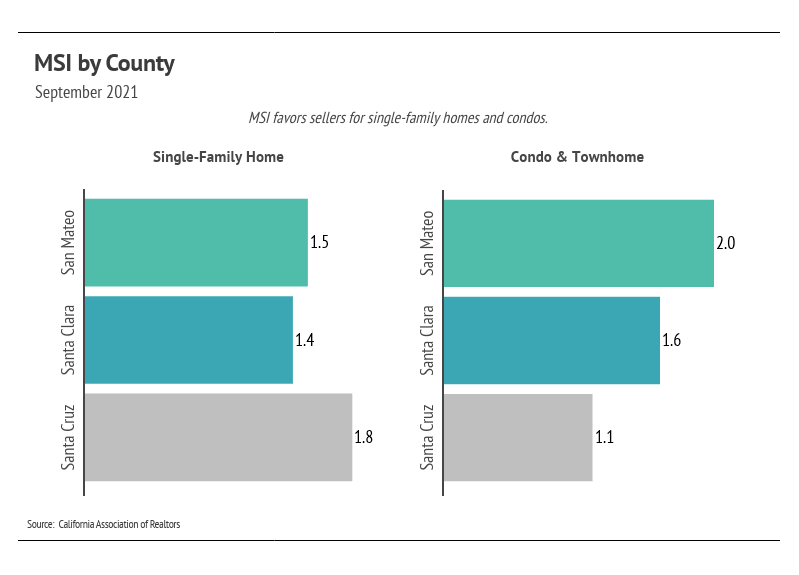
Months of Supply Inventory (MSI) quantifies the supply/demand relationship by measuring how many months it would take for all current homes for sale on the market to sell at the current rate of sales. The average MSI is three months in California, which indicates a balanced market. An MSI lower than three indicates that there are more buyers than sellers on the market (meaning it’s a sellers’ market), while a higher MSI indicates there are more sellers than buyers (meaning it’s a buyers’ market). MSIs in Silicon Valley are near all-time lows for single-family homes and condos, indicating a sellers’ market in all markets.
Our team is committed to continuing to serve all your real estate needs while incorporating safety protocol to protect all of our loved ones.
In addition, as your local real estate experts, we feel it’s our duty to give you, our valued client, all the information you need to better understand our local real estate market. Whether you’re buying or selling, we want to make sure you have the best, most pertinent information, so we put together this monthly analysis breaking down specifics about the market.
As we all navigate this together, please don’t hesitate to reach out to us with any questions or concerns. We’re here to support you.
Stay up to date on the latest real estate trends.

A Bay Area Realtor's approach to schools, neighborhoods, and long-term value for families making a move


Part 1 of HAYLEN's series on the 2026 CCIM Spring Forum in Philadelphia
You’ve got questions and we can’t wait to answer them.