October Newsletter – Housing Market Updates for the Greater Bay Area

Median prices for single-family homes had the largest year-over-year gain of 2020 and reached another all-time high.
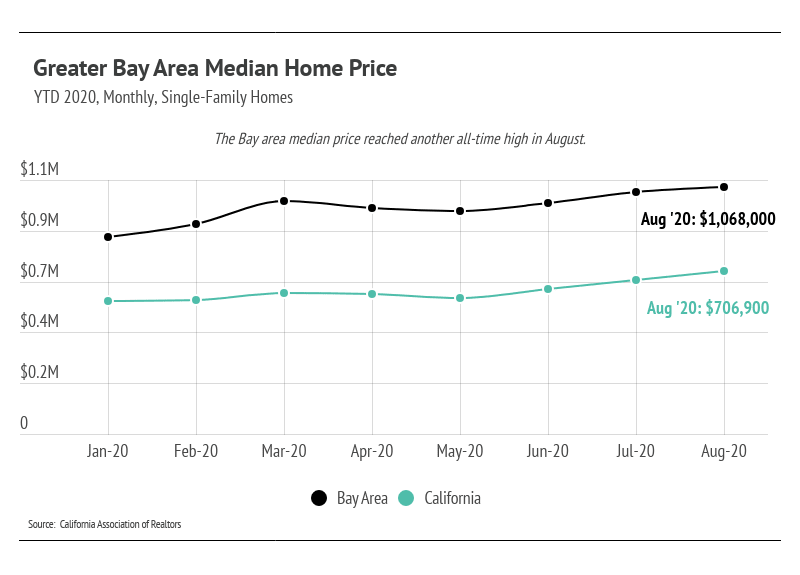
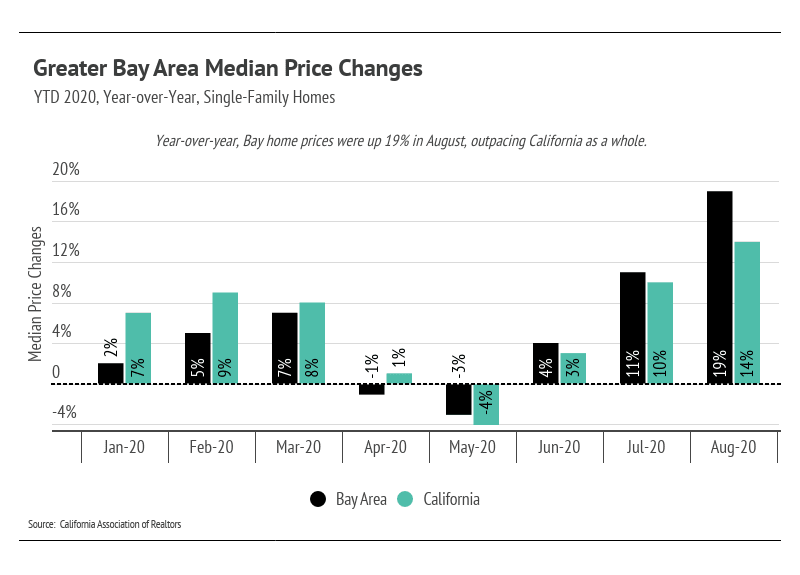
Year-over-year, median single-family home prices were up 19% in the Greater Bay Area.
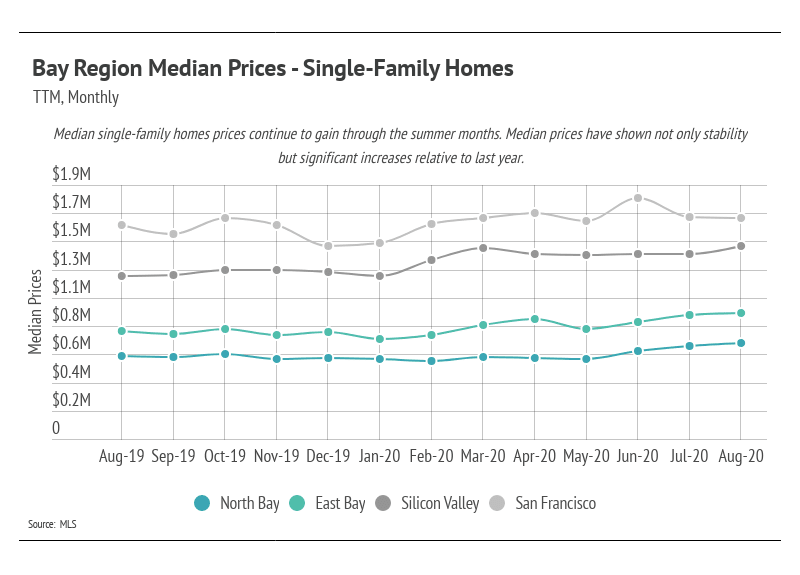
In this newsletter, we break down the Bay Area into four regions, as follows:
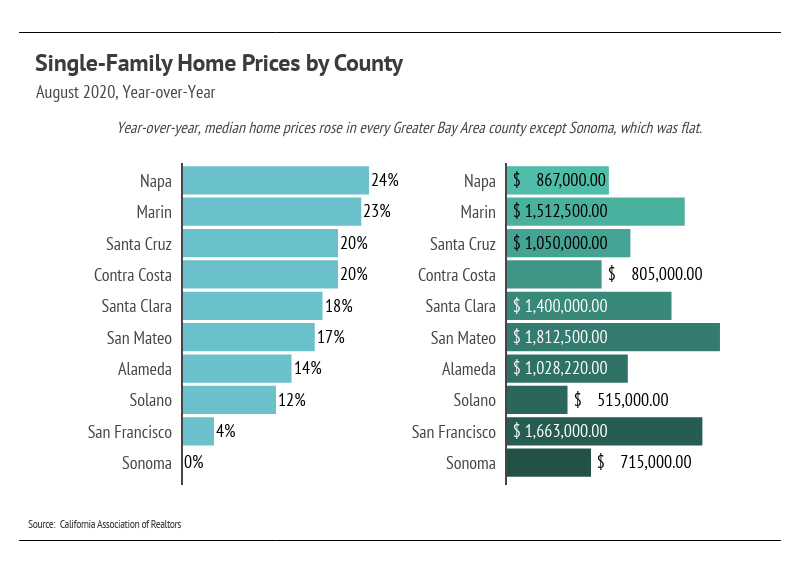
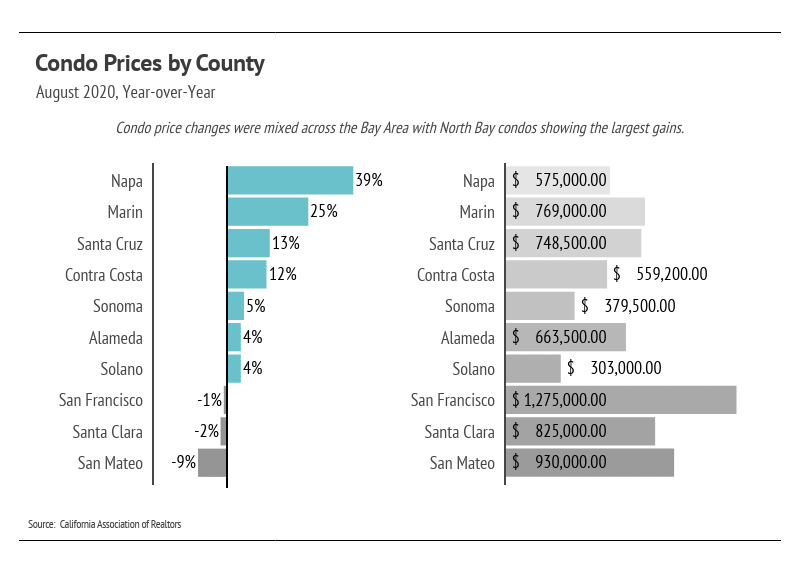
Median condo prices were mixed, but mostly showed positive gains. Condos in Napa and Marin experienced large year-over-year gains, while San Mateo had the largest decline (-9%).
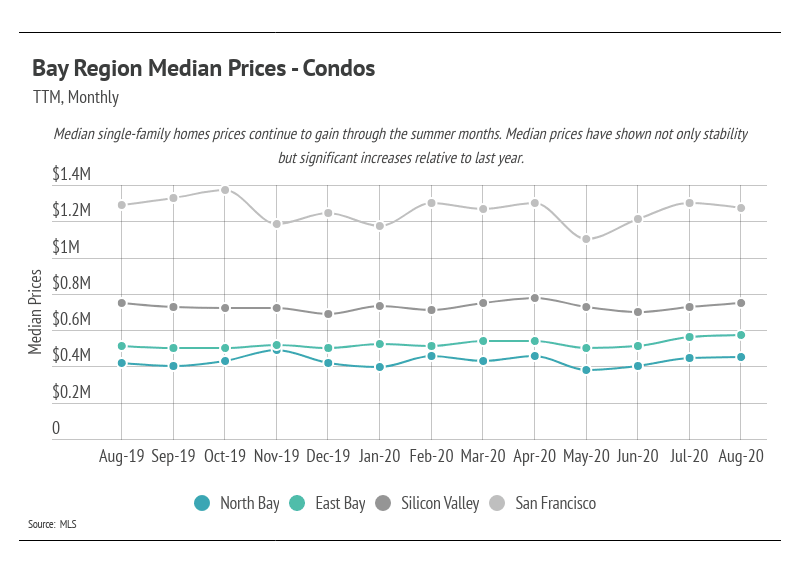
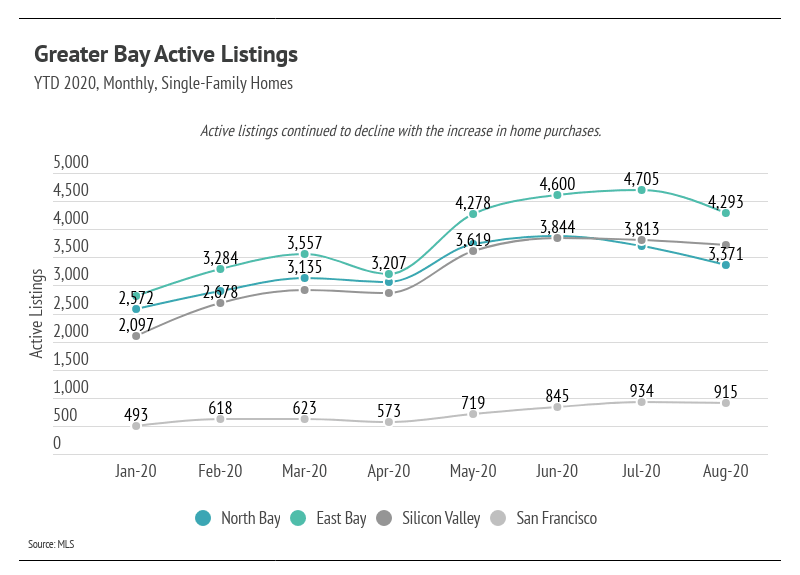
Total inventory decreased in August, as the number of homes under contract rose for both single-family homes and condos. Lack of supply compared to demand typically buoys Bay Area prices, and this is still the case for single-family homes, with far fewer homes for sale than this time last year—with the exception of San Francisco, which had a 45% increase in homes for sale.
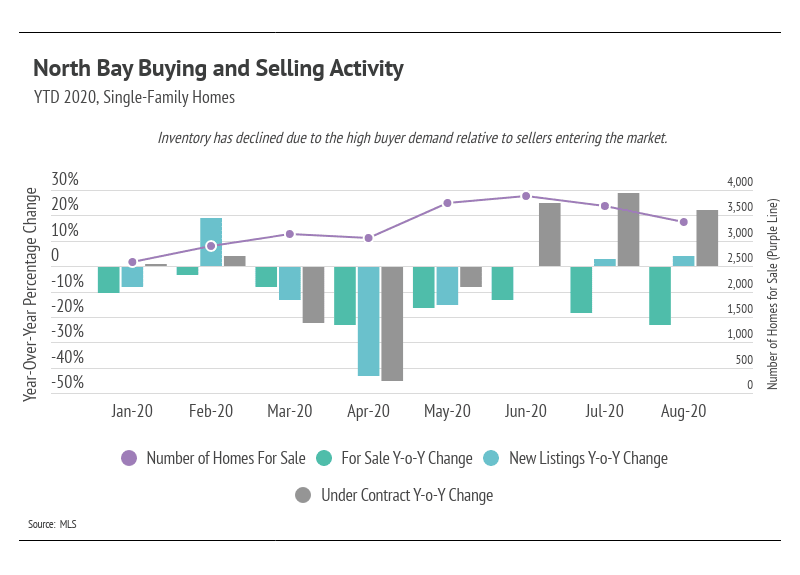
To understand buyer and seller sentiment in the different Bay regions, we can look at how new listings and homes under contract factor into the total inventory in a given month. Using 2019 as a normal year, relative to 2020, we can see the year-over-year abnormalities and seasonal changes.
During the initial months of the pandemic (March, April, and May), buyers and sellers hesitated to enter the market or withdrew from it entirely. Buyers of both single-family homes and condos mostly stayed out of the market from March through May, causing inventory to build. Buyers came back to the market in June, a month before we started seeing an increase in new listings.
New listings for single-family homes increased in July and August but were met with a dramatic increase in sales, causing a decrease in inventory. The figures below show the specific buyer and seller sentiments over time for each region.
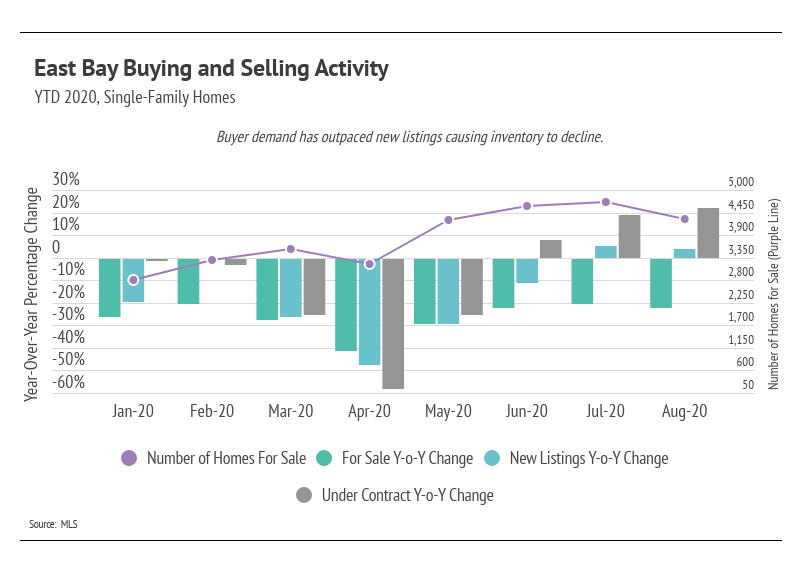
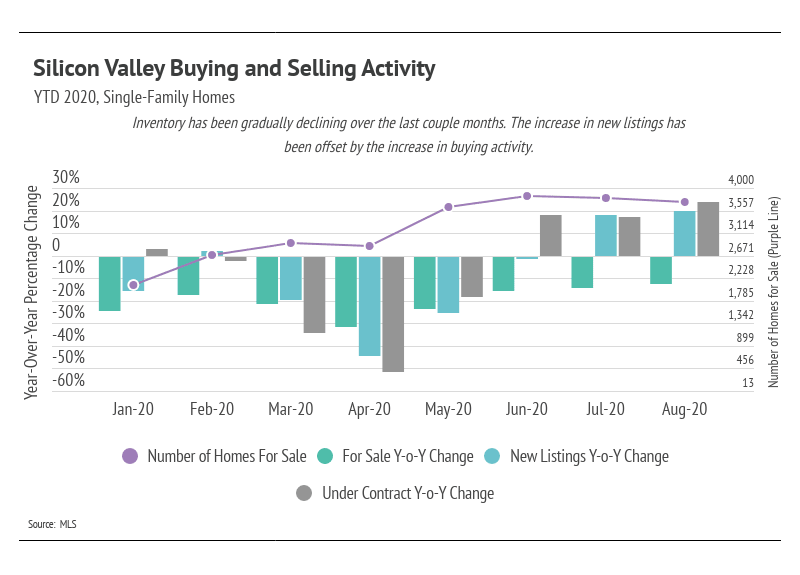
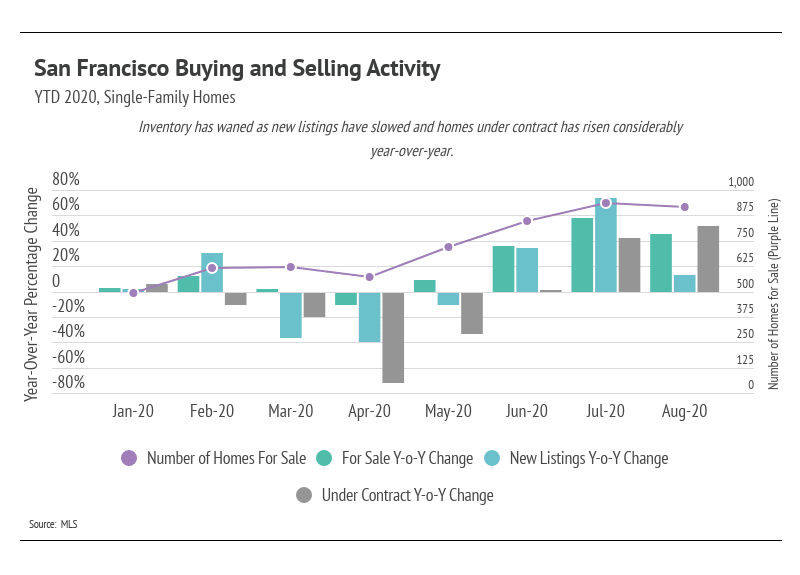
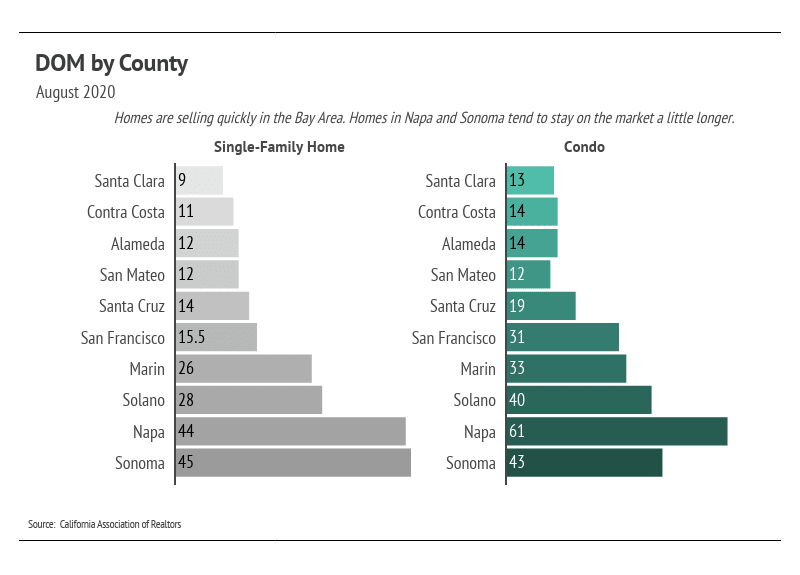
The Days on Market (DOM) trended down as buying activity increased. Single-family homes and condos sold at similar speeds in the same counties. The lower inventory and faster pace of sales caused the Months of Supply Inventory to remain low.
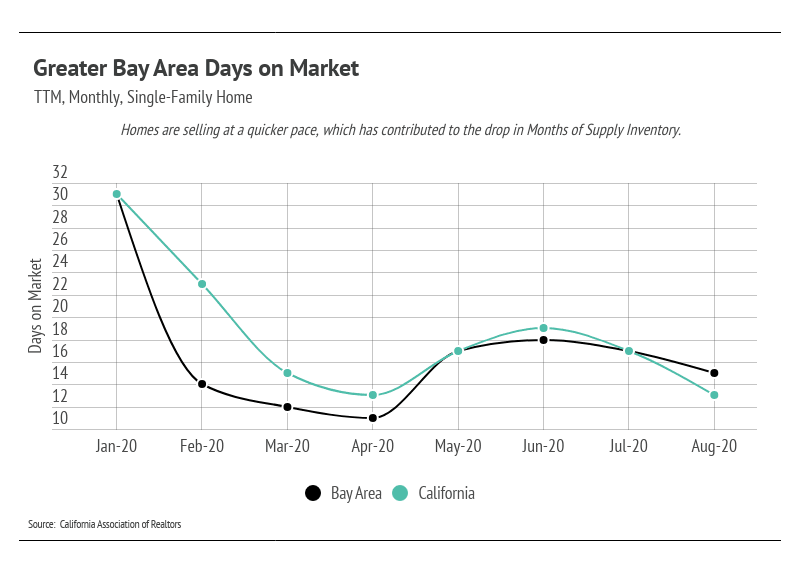
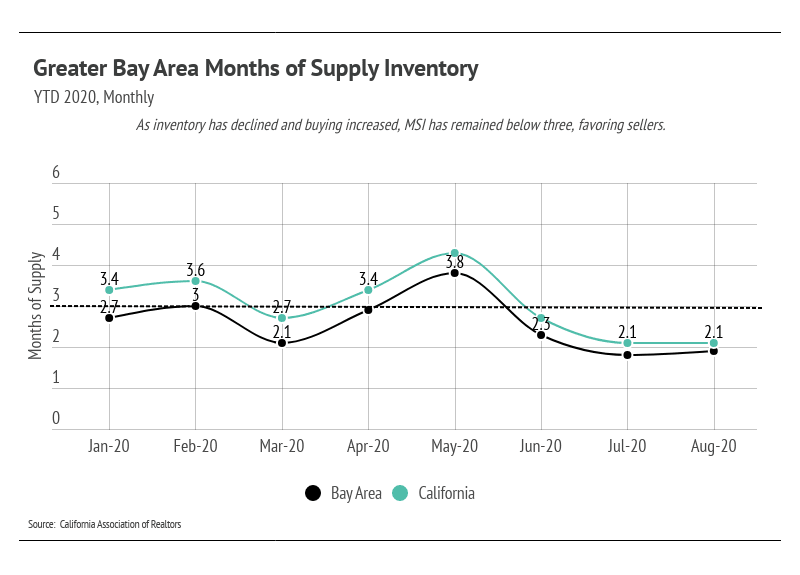
We can look to Months of Supply Inventory (MSI)—the measure of how many months it would take for all current homes for sale on the market to sell at the current rate of sales—as a metric to judge whether the market favors buyers or sellers. The average MSI is three months in California, which indicates a balanced market. An MSI lower than three means that buyers are dominating the market and there are relatively few sellers (a sellers’ market), while a higher MSI means there are more sellers than buyers (a buyers’ market). The MSI for single-family homes is typically below three, and an MSI of 1.9 is low, firmly favoring sellers. The MSI for condos is generally more balanced, around three.
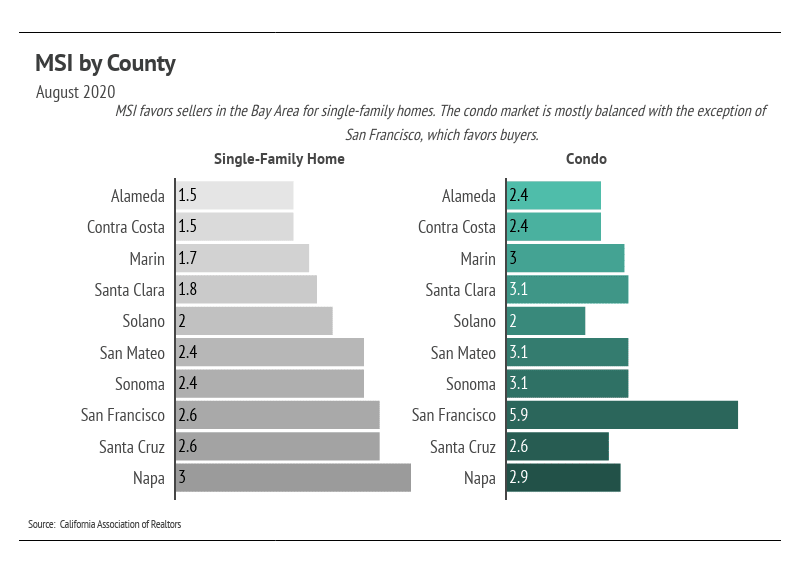
In summary, the single-family home market in particular is heavily undersupplied, a byproduct of the desirability of the Bay Area. Condo supply and demand was mixed across counties, but most saw median price gains. Overall, the housing market has shown its resilience through the pandemic and remains one of the safest asset classes. As we digest seemingly endless stories on negative economic data, we are pleased to report that home ownership has offered a sense of stability.
Moving forward, we anticipate new condo listings to slow. Home prices will likely remain stable. The fall/winter season tends to see a slowdown in activity, as well, although this year we may see a new trend.
As always, we remain committed to helping our clients achieve their current and future real estate goals. Our team of experienced professionals are happy to discuss the information we have shared in this newsletter. We welcome you to contact us with any questions about the current market or to request an evaluation of your home or condo.
Stay up to date on the latest real estate trends.





A Bay Area Realtor's approach to schools, neighborhoods, and long-term value for families making a move

You’ve got questions and we can’t wait to answer them.