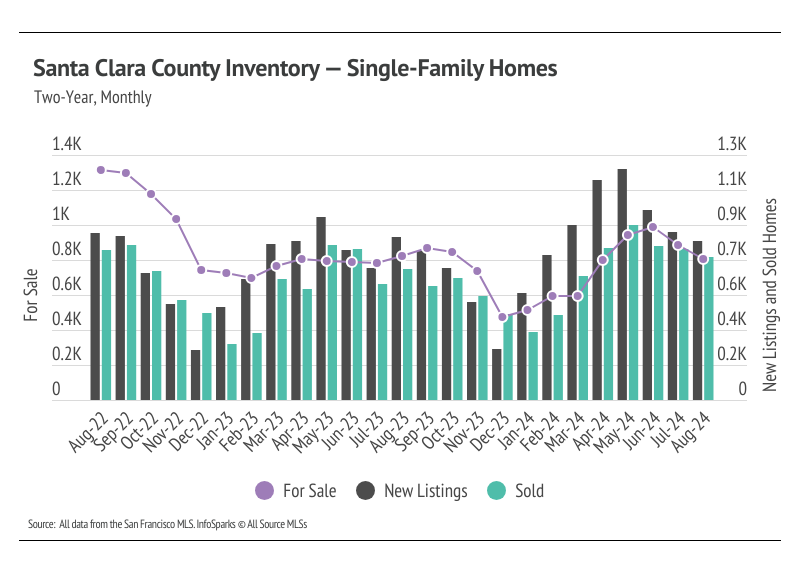
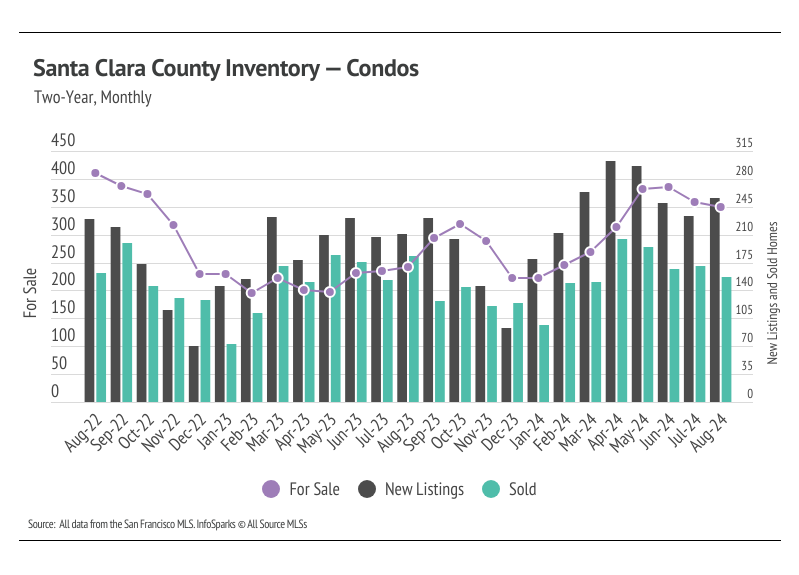
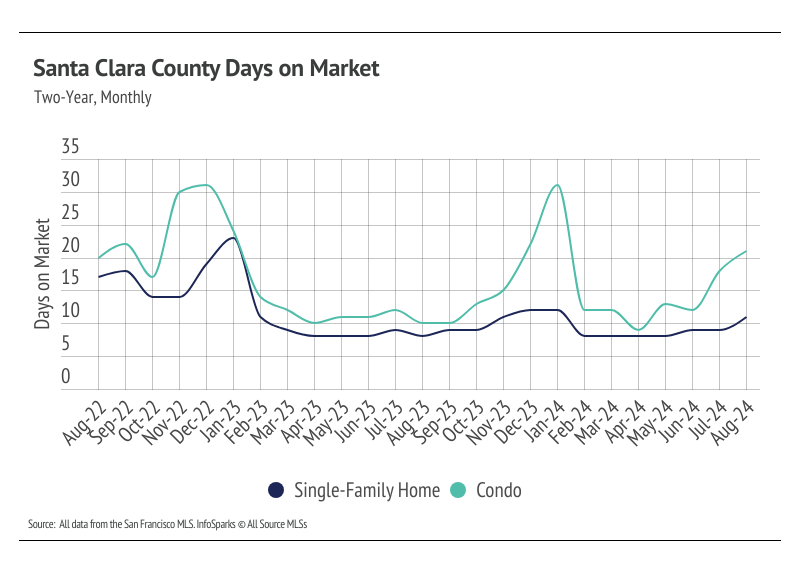
In August, inventory and new listings declined, which is normal for this time of year, while home sales rose. Compared to this time last year, inventory has increased significantly, up 10%. Sales are up 9% for single-family homes, but condo sales declined 13%. Any amount of increasing inventory is good for the Santa Clara market. Inventory still has a long way to go before the market begins to become more balanced. When we take a longer look back and compare the supply of homes in August 2019 (pre-pandemic) to now, active listings have decreased by 62%. With that in mind, it’s actually quite impressive that sales have only declined by 18%.
Total inventory has trended lower essentially since 2010, but active listings fell precipitously from September 2019 to December 2021, as sales increased dramatically during that period. Supply became less volatile but still trended lower from January 2022 to the present — 32% lower than two years ago. Low inventory and new listings, coupled with high mortgage rates, have led to a substantial drop in sales and a generally slower housing market. Typically, inventory begins to increase in January or February, peaking in July or August before declining once again from the summer months to the winter. In 2023, sales and inventory didn’t resemble the typical seasonal peaks and valleys. It’s looking like 2024 inventory, sales, and new listings will follow historically seasonal patterns, albeit at a depressed level. It’s clear that supply will remain tight until spring 2025 at the earliest.
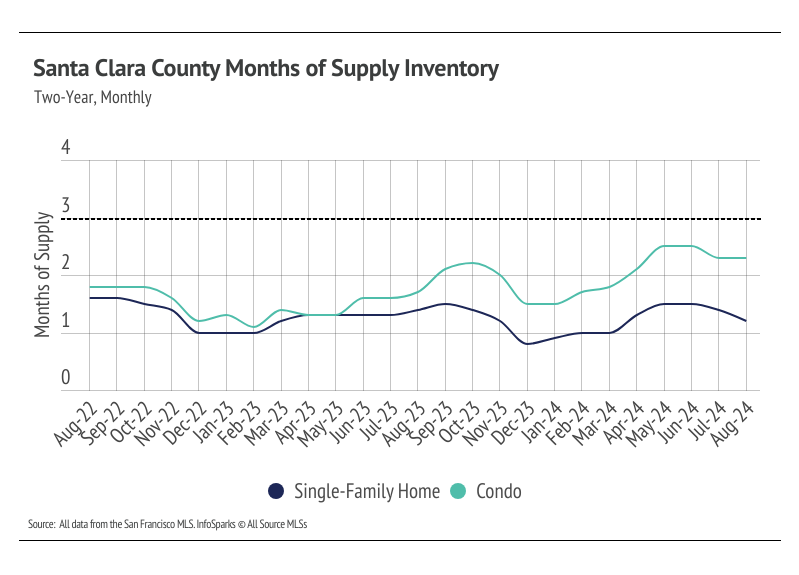
Months of Supply Inventory in August 2024 indicated a sellers’ market for single-family homes and condos
Months of Supply Inventory (MSI) quantifies the supply/demand relationship by measuring how many months it would take for all current homes listed on the market to sell at the current rate of sales. The long-term average MSI is around three months in California, which indicates a balanced market. An MSI lower than three indicates that there are more buyers than sellers on the market (meaning it’s a sellers’ market), while a higher MSI indicates there are more sellers than buyers (meaning it’s a buyers’ market). The San Mateo housing market tends to favor sellers, which is reflected in its low MSI, especially for single-family homes. MSI has been below three months since September 2012 (2012 is not a typo!) for single-family homes. Condo MSI was similar except that it rose above three in 2019 and 2020. For nearly four years, MSI has been below three months of supply, indicating a strong sellers’ market.
Local Lowdown Data
As your local real estate experts, it’s our duty to give you all the information you need to better understand our local real estate market. Whether you’re buying or selling, we want to make sure you have the best, most pertinent information. Please don’t hesitate to
reach out to us with any questions or concerns. We’re here to support you.