June 2023 Newsletter - Bay Area Local Lowdown

Stay up to date on the latest real estate trends.

A Bay Area Realtor's approach to schools, neighborhoods, and long-term value for families making a move


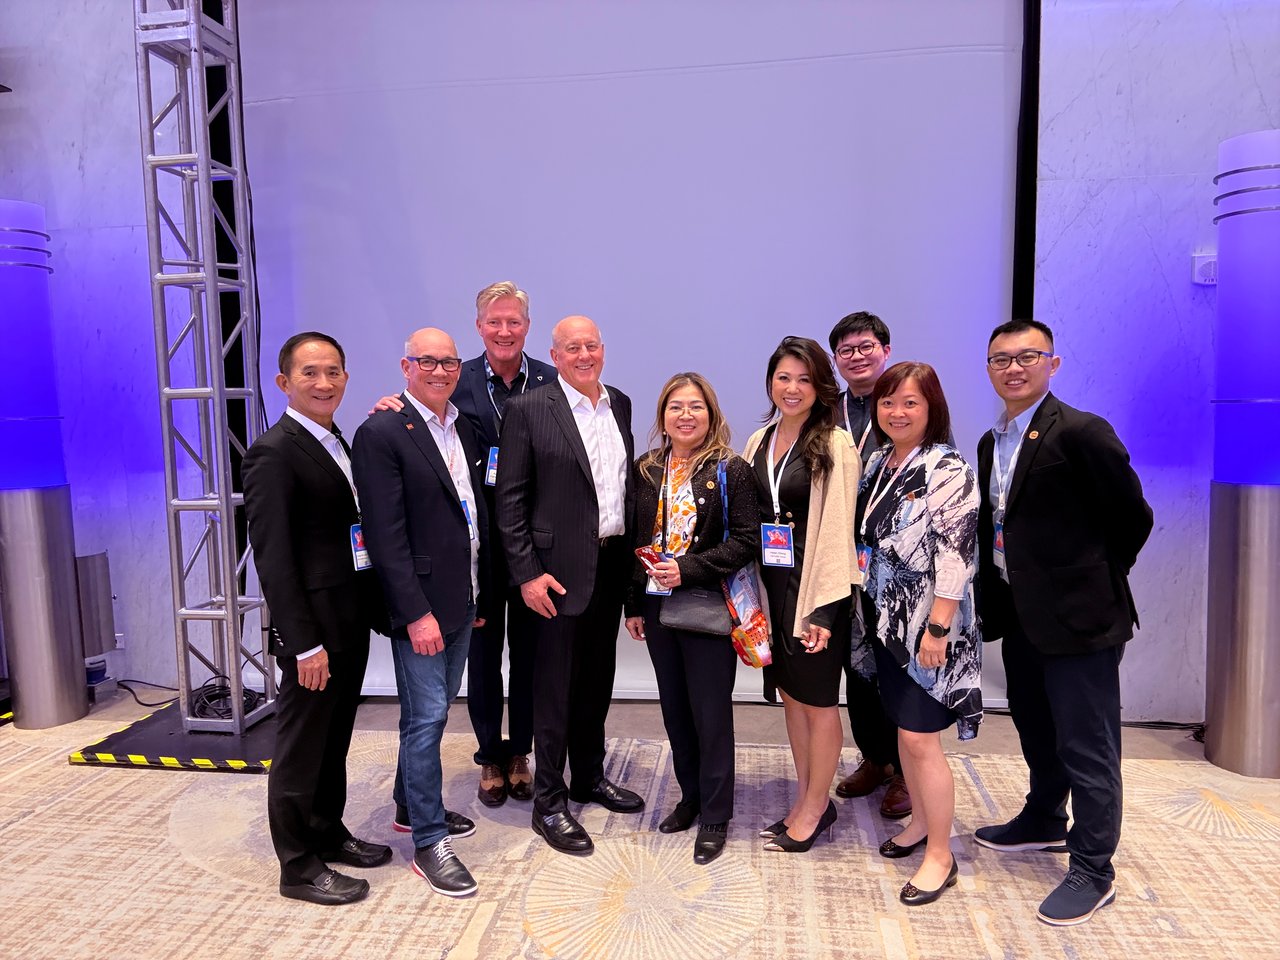
Part 1 of HAYLEN's series on the 2026 CCIM Spring Forum in Philadelphia
You’ve got questions and we can’t wait to answer them.