The Bay Area Market Update: Where We Are Heading Into Summer 2026
From the June HAYLEN Bay Area Market Update webinar, hosted by Helen Chong, CCIM — Founder of HAYLEN Group.
After a couple of years away, our Bay Area Market Update webinar is back — and there is so much going on right now that we feel we owe everyone an update on what's happening in our market.
A quick word on how we work first. We're a small but mighty team of six. Some of us focus on residential real estate, some of us handle commercial transactions, and across the board we are very data-focused agents. Whenever we sit down for a consultation, you'll notice we share a lot of statistics and data, because our objective is to help our clients make a more informed decision rationally, instead of based on emotion. That's the same lens we bring to this market update.
One of the questions we always get asked is, "Isn't summer the hottest real estate market — the time you can sell for the highest price possible?"
When you look at the last five years, the answer is more nuanced than people expect. Inventory actually peaks around the summertime nearly every year — around August in 2021, in the July–August timeframe in 2022, and again in July–August of 2024. In 2025, July inventory peaked even higher than in the previous four years. The one exception was 2023, when we had unusually low inventory in the summer — and there's an interesting story behind that, which we'll come to. As we head into this summer, you'll see inventory climb again.
But here's the key: no matter how much the number of listings fluctuates, the number of sold listings tends to peak around 4,000 to 4,500 listings sold around springtime, every year.
So to answer the question — summer is not exactly the hottest real estate market. In summer you may actually find a lot more options, because many people are out on vacation. Spring is really the best time for sellers to consider selling, especially in March or April.
Months of inventory. Across the five counties — Alameda, Contra Costa, San Francisco, San Mateo, and Santa Clara — we're running around 2.5 months of inventory, as low as about 1.4 months and as high as 2.8 months. In a balanced market, we usually see about four to six months. In the Bay Area, we've been spoiled — during the hot years we saw less than one month of inventory, so two to two-and-a-half months can feel high to us. But compared to other parts of the country, we are still in really good shape.
Days to sell. We're still seeing pretty good numbers. Last year, median days on market climbed through August to about 20 days, then ticked back up toward the end of the year. A quick reminder when you read January data: those figures typically reflect December activity, because it takes about 30 days to close escrow. So a reading of 25 days in January really reflects how long December's listings sat on the market. By springtime, days on market dropped back to less than two weeks.
Competition. As much as we keep hearing the market is slow, we are still seeing offers come in over 100% of asking — generally about 2, 3, or 4% over asking, and this past March we hit about 6.3% over asking.
You may have seen the NBC Bay Area report that San Jose currently ranks second in the U.S. for home sellers pulling listings. Unfortunately, we are seeing a lot of listings sit on the market for a long time, so some sellers decide to pull them off.
What stands out in the data is that Santa Clara County has historically had fewer withdrawn listings than Alameda and Contra Costa counties — but in the past couple of months, that line suddenly jumped above both. In terms of volume, we're at 453 listings pulled, which is actually still a little lower than the same May–June–July window in 2025.
We're also seeing more price reductions. In a slower month like November or December, we had roughly 284 and 145 listings dropping price; that number shot up in March, April, and May for Santa Clara County. San Mateo County has been more moderate, while Alameda and Contra Costa counties saw a more dramatic increase.
The good news: we are not seeing a drastic rise in transactions falling through. Buyers who are in contract are still going through the entire process — we're not seeing people get scared and drop out of escrow.
This is one of our favorite charts. We track the median sales price of single-family homes across the five counties every month since March 2022, and it really does tell a story. (Using Santa Clara County to keep the numbers in focus.)
2022 — "someone turned off the light." In March 2022, around the interest-rate hike, prices ran up fast. The analogy I keep coming back to is that it felt as if somebody just turned off the light. We'd hold open houses, drop prices, call other agents — and people simply weren't showing up. They were scared when they saw how fast rates climbed. Santa Clara County peaked around $1.95 million in April 2022 and then went down, down, down to $1.465 million by December 2022. Other counties bottomed out around January 2023: San Mateo from $2.25 million to $1.48 million; Alameda from $1.5 million to $1.022 million; San Francisco from about $2,050,000 to $1.385 million; and Contra Costa from $980,000 to $725,000.
A lot of people now think, "I wish I'd bought at the time." But back then, the consumer psychology was fear — buyers assumed prices would keep falling.
2023 — the adjustment period. Buyers started coming back out as they accepted that rates weren't going to drop, getting used to the high 6% or even 7% range. Santa Clara County came back up from $1.465 million to about $1.8 million by June 2023, then held steady — and the same pattern held across the other counties.
2024 — above the 2022 peak. Many people expected rates to come back down, and a surge of buyers returned early in the year. Even with rates still in the high 6s — 6.75%, almost 7% — our median sales price climbed above the 2022 peak, with at least 2% higher rates than before. Then reality set in that rates weren't dropping quickly, summer cooled things off, and the November 2024 election added uncertainty. Before elections, people tend to say "let's wait and see." But no matter who gets elected, buyers eventually come back out — because now they have an answer and more certainty.
2025 — the tariffs "dimmed the light." In January 2025 the market came back up, peaking around May for Santa Clara County at $2.15 million; San Mateo peaked in February 2025 at $2.075 million; Alameda at $1.36 million; San Francisco at $1.907 million; and Contra Costa around $900,000 in June 2025. Then came the tariffs announcement — not quite turning off the light, but definitely dimming it. We'd have an open house with 60 people, and right after the tariffs were announced, those same people stopped making offers. With tariffs announced at 35%, sometimes 100%, sometimes more, buyers weren't sure what was going on, so they slowed down. It didn't drop a lot — prices eased to around $1.9, $1.8 million.
2026 — the pattern repeats. Once January arrived, pricing started to recover again. By April 2026, Santa Clara came back up to $2.1 million, easing to $2.05 million in May; San Mateo rose to $2.22 million; Alameda $1.38 million; San Francisco $2.2 million; and Contra Costa $920,000. This is also when we began to see the effect of the Iran war — which began at the end of February, though we didn't really see the slowdown until May.
Where that leaves us. From the 2022 lows, prices have come up 39.93% in Santa Clara County, 44% in San Mateo, 31% in Alameda, 42% in San Francisco, and 22% in Contra Costa. Compared to the 2025 peak, Santa Clara County is the only one that has actually come down — about –4.65% — while everyone else is still higher than their 2025 peak: San Mateo +5.34%, Alameda +1.47%, San Francisco +15.36%, and Contra Costa +2.22%. San Francisco's strength has shown up in the news lately, and there's a reason for it that we'll come back to.
We track the rate projections from Fannie Mae, the Mortgage Bankers Association, and Wells Fargo every single month. This month their projections were fairly consistent — clustered in the low 6% range, with the expectation that rates should be coming down. That said, I expect those projections may change again next month, given the new inflation news and other factors.
Looking back historically puts today in perspective. In March 2022 the rate was 3.97% — and that was already considered low; many of our clients locked in around 3% or 2.85%. Historically, we never really had rates that low; they're usually around 5%, 6%, or higher. From March to April 2022, the rate jumped to 4.95% — almost a full percentage point in one month. May added another 40 basis points to 5.38%, and by November it hit almost 8%. People weren't used to it, and it changed affordability immediately — your pre-approval amount shrinks. Rates eventually settled back to the low 6s, then rose again. In February 2025 the low was around 6.1% — some sources said about 5.99%, and the news celebrated rates finally dipping under 6%. But instead of continuing down, they went back up. Mortgage News Daily showed 5.99% on February 24, 2026; then, around February 28, with the war, rates started climbing again.
Rental trends. San Francisco's average rent is now about $3,440 per month, with some neighborhoods hitting $4,000 — up 10.4% from last year. San Jose is around $2,789 per month, up 4.4%, while Oakland is around $2,166 per month, up about 3.7%.
The June 4 SFGate article put it well: the AI gold rush is rewriting Bay Area housing, and it has substantially increased rent growth — SoMa up 36%, Mission Bay up 22%, South Beach up 21%, and other areas up sharply because of the AI boom. At the same time, many people worry about AI taking jobs and causing layoffs — so what happens next?
Comparing the three metros. Looking at employment, construction, vacancy, and rent across San Francisco, San Jose, and Oakland: employment growth is negative across all three, but San Jose dropped the least at –0.2% (versus Oakland –0.6% and San Francisco –0.4%). San Jose also has the least new construction — less new supply, which helps maintain rents — and the smallest drop in vacancy. Its rent grew 4.4%, versus 3.4% in San Francisco and 2% in Oakland. On balance, San Jose is doing pretty well compared to the other two markets.
Submarkets. Within Silicon Valley and the East Bay — the areas clients most often ask about for multifamily — Sunnyvale has the highest asking-rent growth at 6.7% over the last 12 months and the lowest vacancy at 3.4%. The most affordable area by cap rate is Hayward–Castro Valley–Union City at a 6.1% cap. The highest asking rent is in Santa Clara at $3,735, and the lowest is Hayward–Castro Valley–Union City at $2,304 — which also has the least new construction, so it isn't overflooded with supply. These are the factors investors weigh before deciding where to invest.
Industrial. Comparing San Jose Metro, the East Bay, and San Francisco: asking-rent growth in San Jose Metro is still rising 2.3%, while the East Bay fell 2.3%. The median cap rate is most expensive in San Francisco at 5.5%; vacancy is lowest in San Jose Metro at 8.9%; and employment growth is best in San Francisco at 0.07%.
Inventory is increasing.
Sellers have become less patient — more price reductions and more listings withdrawn.
Mortgage rates have come back up above 6%.
Buyers have become a lot more selective.
Investors need more down payment in order to qualify.
The Bay Area is such a unique market. We can't use a blanket statement for every neighborhood or city — it's important to look at what's actually happening, county by county and submarket by submarket. That's exactly why we do these market updates, and why we invited an economist of Dr. Lawrence Souza's caliber to join us for the conversation that followed.
We host the Bay Area Market Update webinar on the second Thursday of every month — bringing you the data, the context, and expert guests to help you make informed, confident decisions about your real estate.
Save your seat for the next session → www.haylengroup.com/webinar
This update is educational and is not financial advice.
Stay up to date on the latest real estate trends.

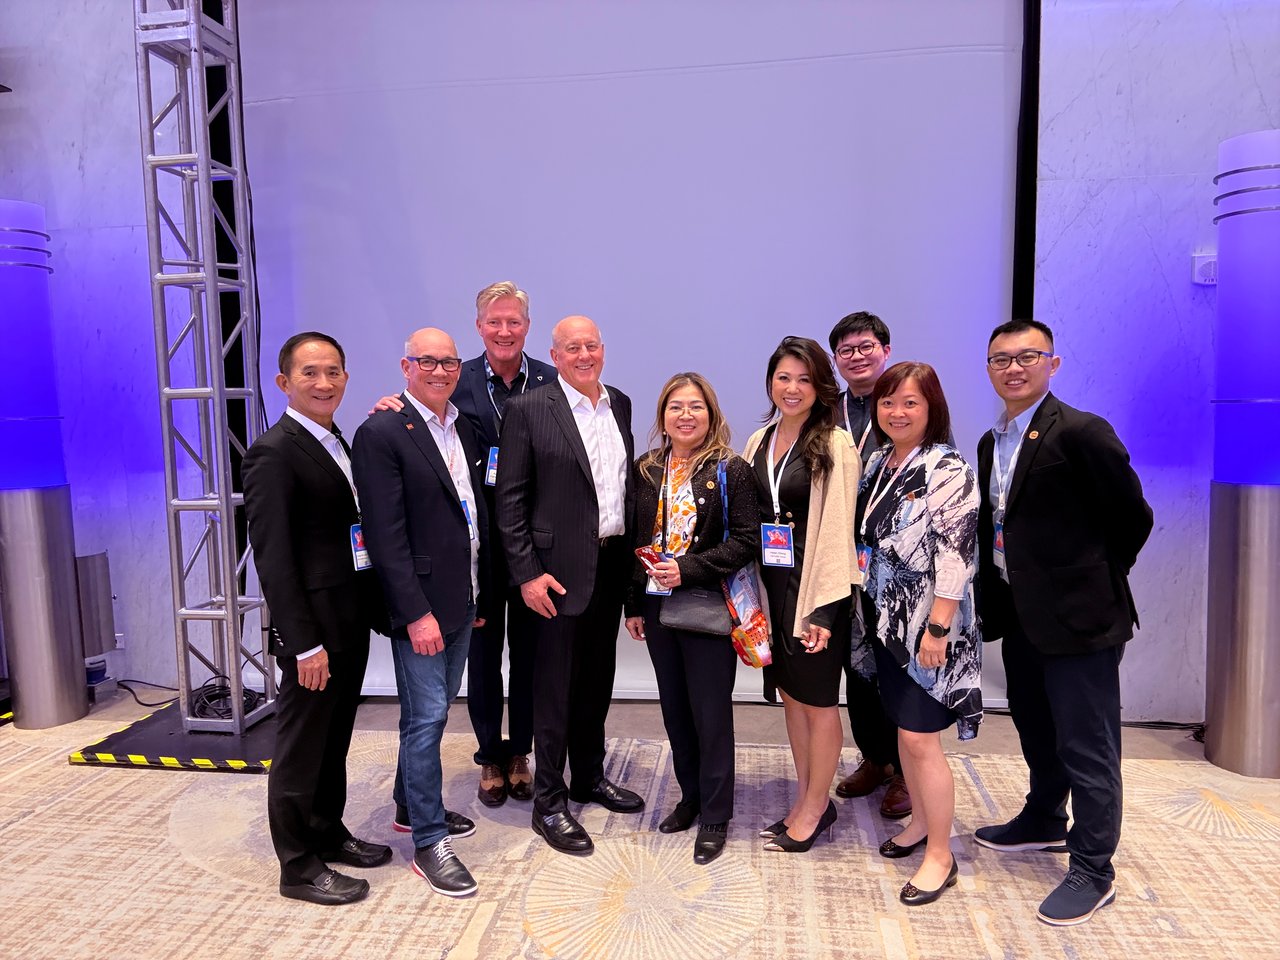

Part 1 of HAYLEN's series on the 2026 CCIM Spring Forum in Philadelphia
You’ve got questions and we can’t wait to answer them.